Fig. 1
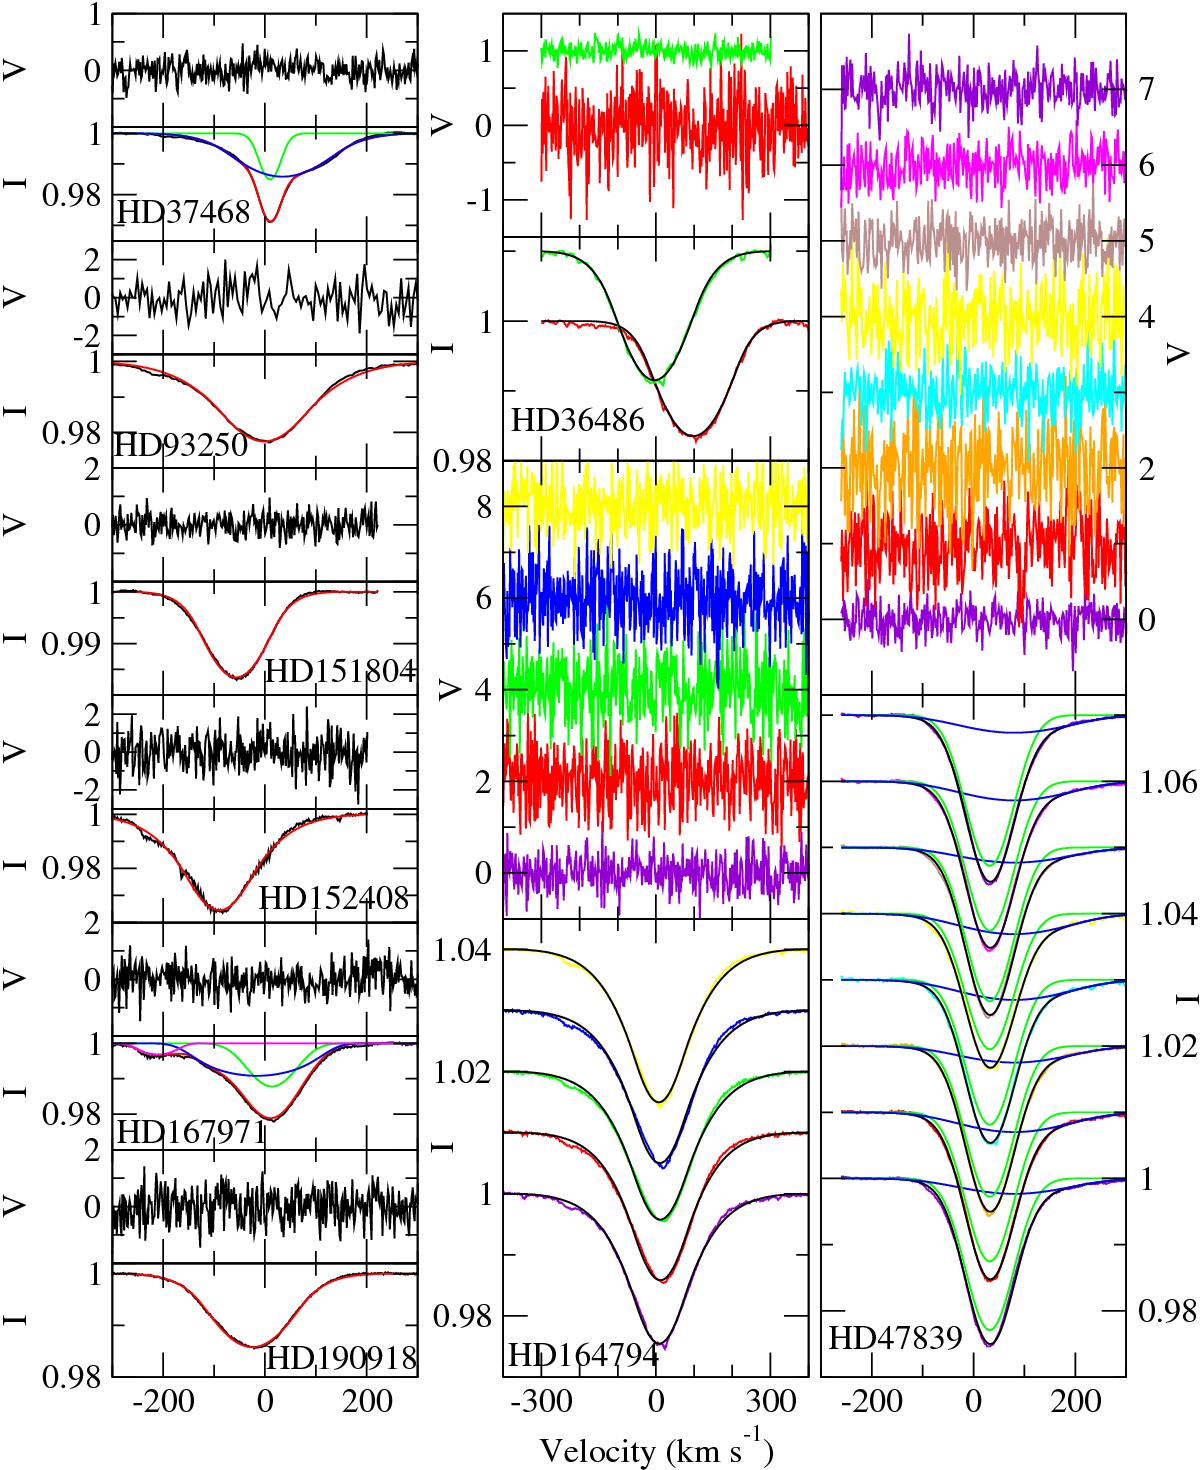
LSD I (bottom panels) and Stokes V (top panels, y-axis multiplied by 10 000) profiles of the nine PACWB available in spectropolarimetric archives. When only one spectrum is available (left panels), observations are indicated in black and the fit in red. If there are several components, the fit of the primary/secondary/tertiary component is shown in blue/green/pink, while the combined fit is shown in red. When several spectra are available for one star (middle and right panels), observations are indicated with various colours, and the fits are indicated in black with primary and secondary component fits indicated in green and blue. In these cases, profiles are artificially shifted upwards for clarity.
Current usage metrics show cumulative count of Article Views (full-text article views including HTML views, PDF and ePub downloads, according to the available data) and Abstracts Views on Vision4Press platform.
Data correspond to usage on the plateform after 2015. The current usage metrics is available 48-96 hours after online publication and is updated daily on week days.
Initial download of the metrics may take a while.