Free Access
Fig. B.1
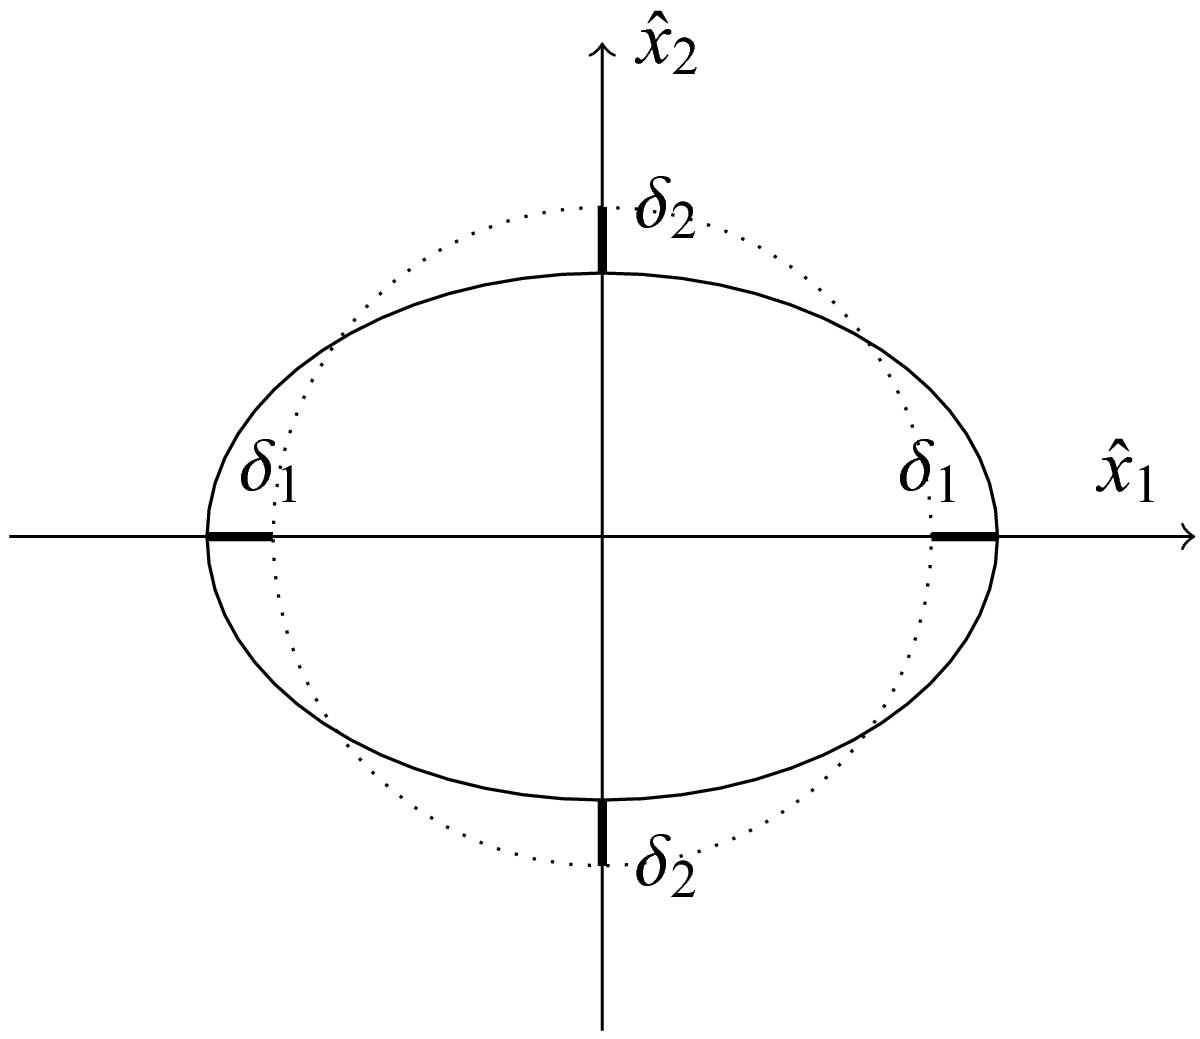
Schematic representation of the deformation of a two-dimensional contour of an equipotential surface. The dotted line is the unperturbed contour, the solid line the perturbed contour. In the tidal approximation, the variations along the positive and negative directions are the same.
Current usage metrics show cumulative count of Article Views (full-text article views including HTML views, PDF and ePub downloads, according to the available data) and Abstracts Views on Vision4Press platform.
Data correspond to usage on the plateform after 2015. The current usage metrics is available 48-96 hours after online publication and is updated daily on week days.
Initial download of the metrics may take a while.