Fig. 7
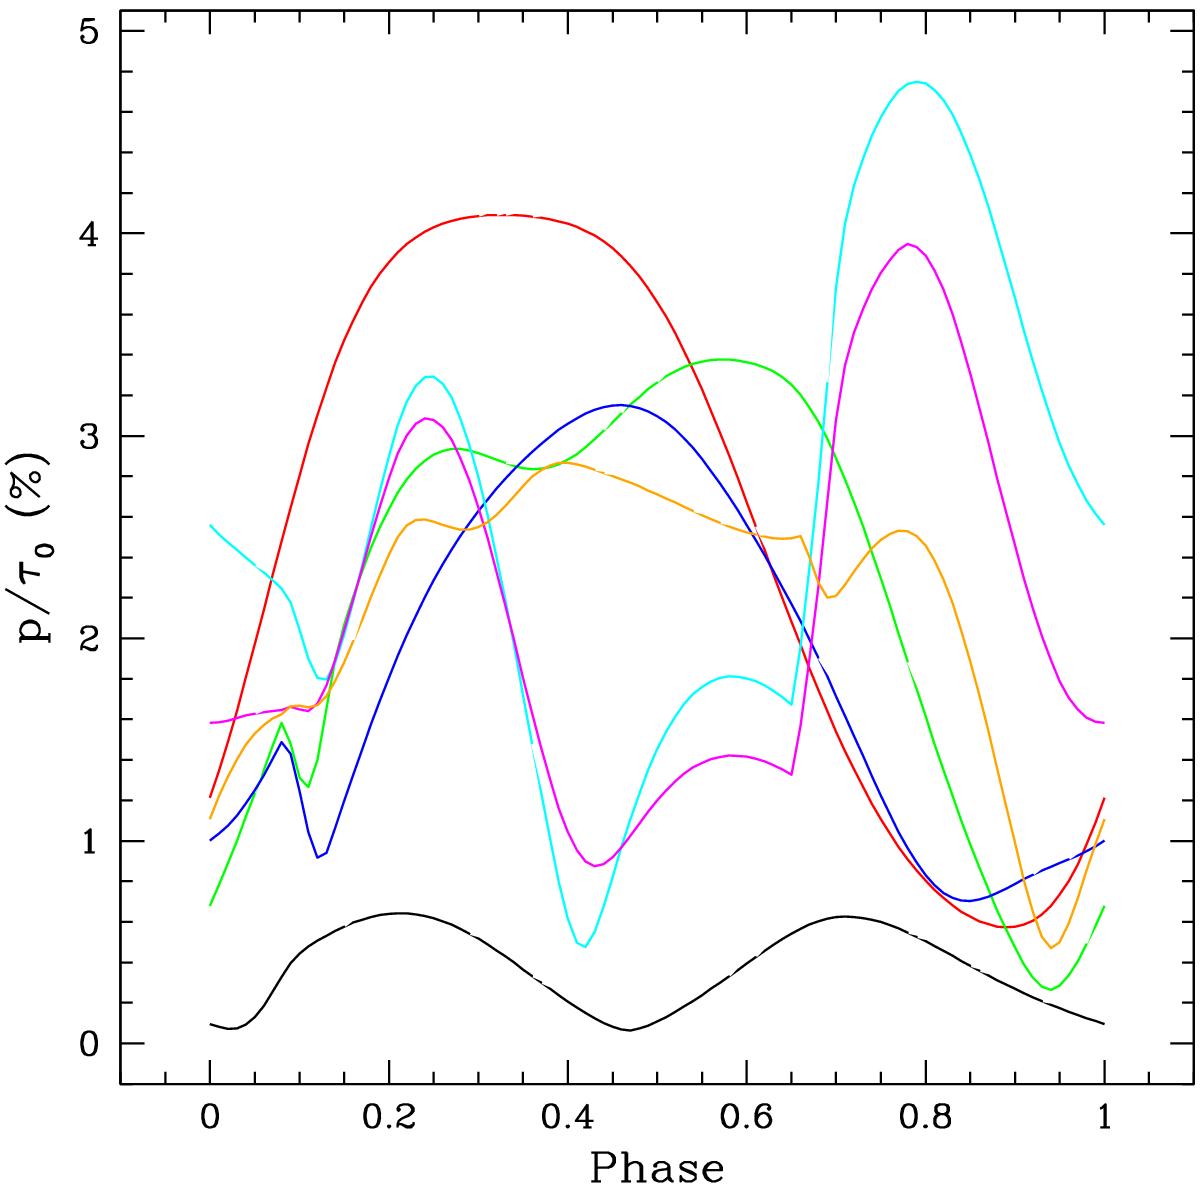
Periodic polarization light curves for a randomized distribution of CIRs across the star. Each curve represents the addition of one more randomly placed CIR. The curves correspond to a number of CIRs of 1 (black), 2 (red), 3 (green), 4 (dark blue), 5 (light blue), 6 (magenta), and 7 (orange). Table 1 lists model parameters of the individual CIRs.
Current usage metrics show cumulative count of Article Views (full-text article views including HTML views, PDF and ePub downloads, according to the available data) and Abstracts Views on Vision4Press platform.
Data correspond to usage on the plateform after 2015. The current usage metrics is available 48-96 hours after online publication and is updated daily on week days.
Initial download of the metrics may take a while.