Fig. B.1
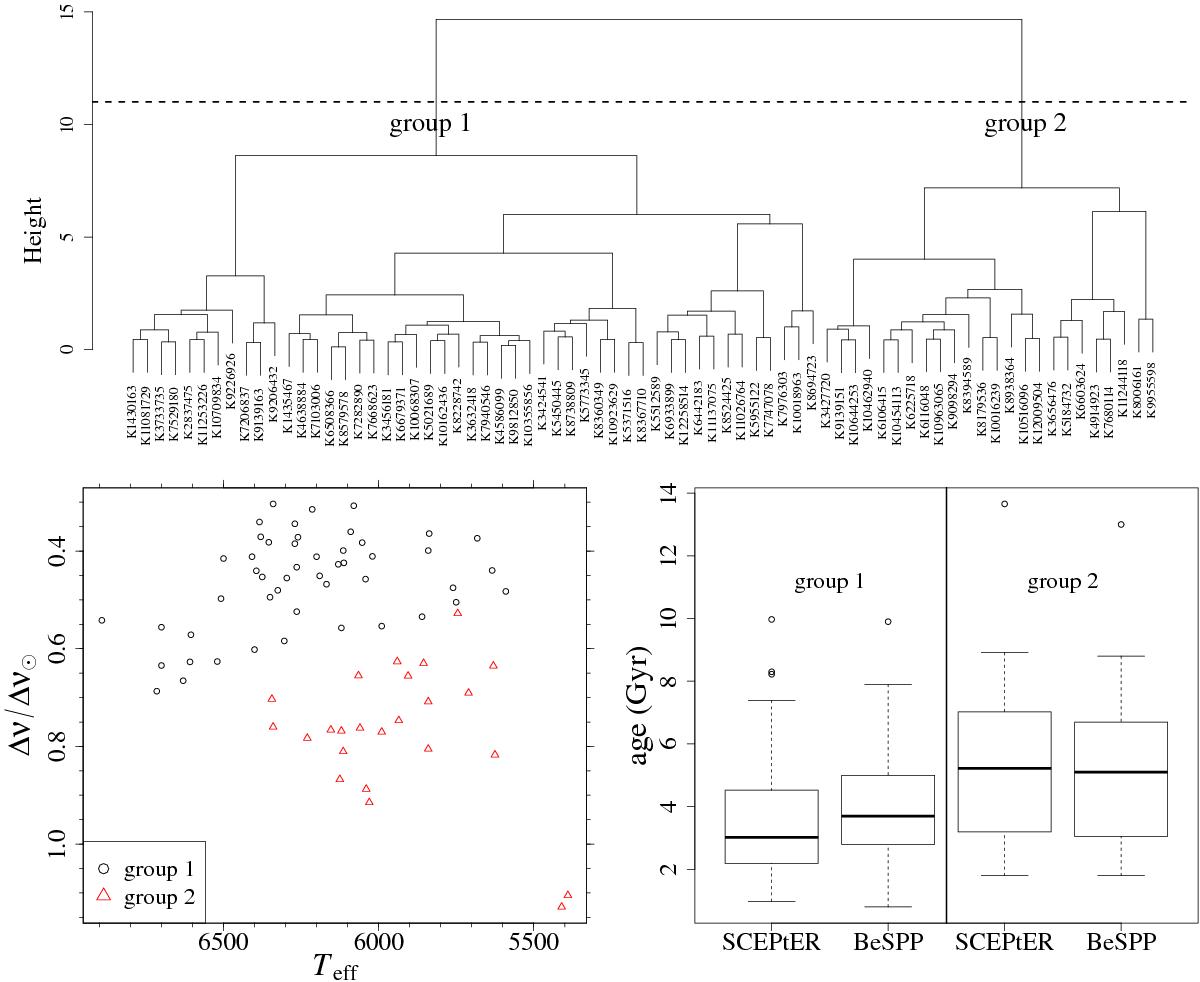
Top row: hierarchical cluster analysis of the observational sample adopted in SCEPtER and BeSPP comparison. The dashed line marks the sub-setting into two groups suggested by the silhouette plot analysis (see text). Bottom row, left: separation of the two group in the plane (Teff − Δν). Bottom row, right: boxplot of age estimates of the two pipelines in the two groups.
Current usage metrics show cumulative count of Article Views (full-text article views including HTML views, PDF and ePub downloads, according to the available data) and Abstracts Views on Vision4Press platform.
Data correspond to usage on the plateform after 2015. The current usage metrics is available 48-96 hours after online publication and is updated daily on week days.
Initial download of the metrics may take a while.