Fig. 8
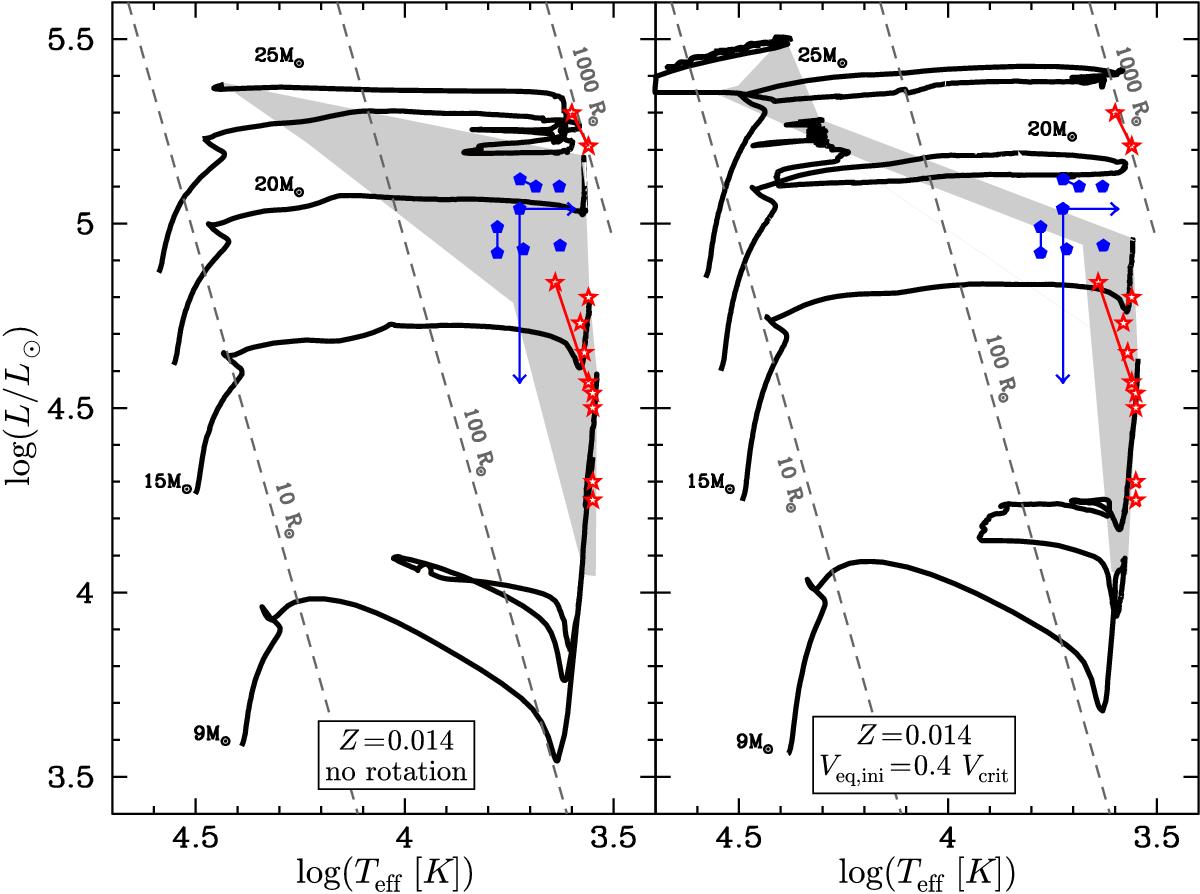
Left panel: evolutionary tracks in the HRD for the nonrotating models computed with the standard mass-loss rates with superposed observed positions of progenitors of core collapse supernovae. The observed data are the same as in Fig. 7. The error bars are not shown for clarity. Progenitors of supernovae predicted by the nonrotating models computed with the various RSG mass-loss rates are found in the shaded area. Right panel: same as the left panel for rotating stellar models. The shaded area shows the region where the progenitors of supernovae are found according to the rotating models with various RSG mass-loss rate prescriptions.
Current usage metrics show cumulative count of Article Views (full-text article views including HTML views, PDF and ePub downloads, according to the available data) and Abstracts Views on Vision4Press platform.
Data correspond to usage on the plateform after 2015. The current usage metrics is available 48-96 hours after online publication and is updated daily on week days.
Initial download of the metrics may take a while.