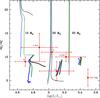
Fig. 6
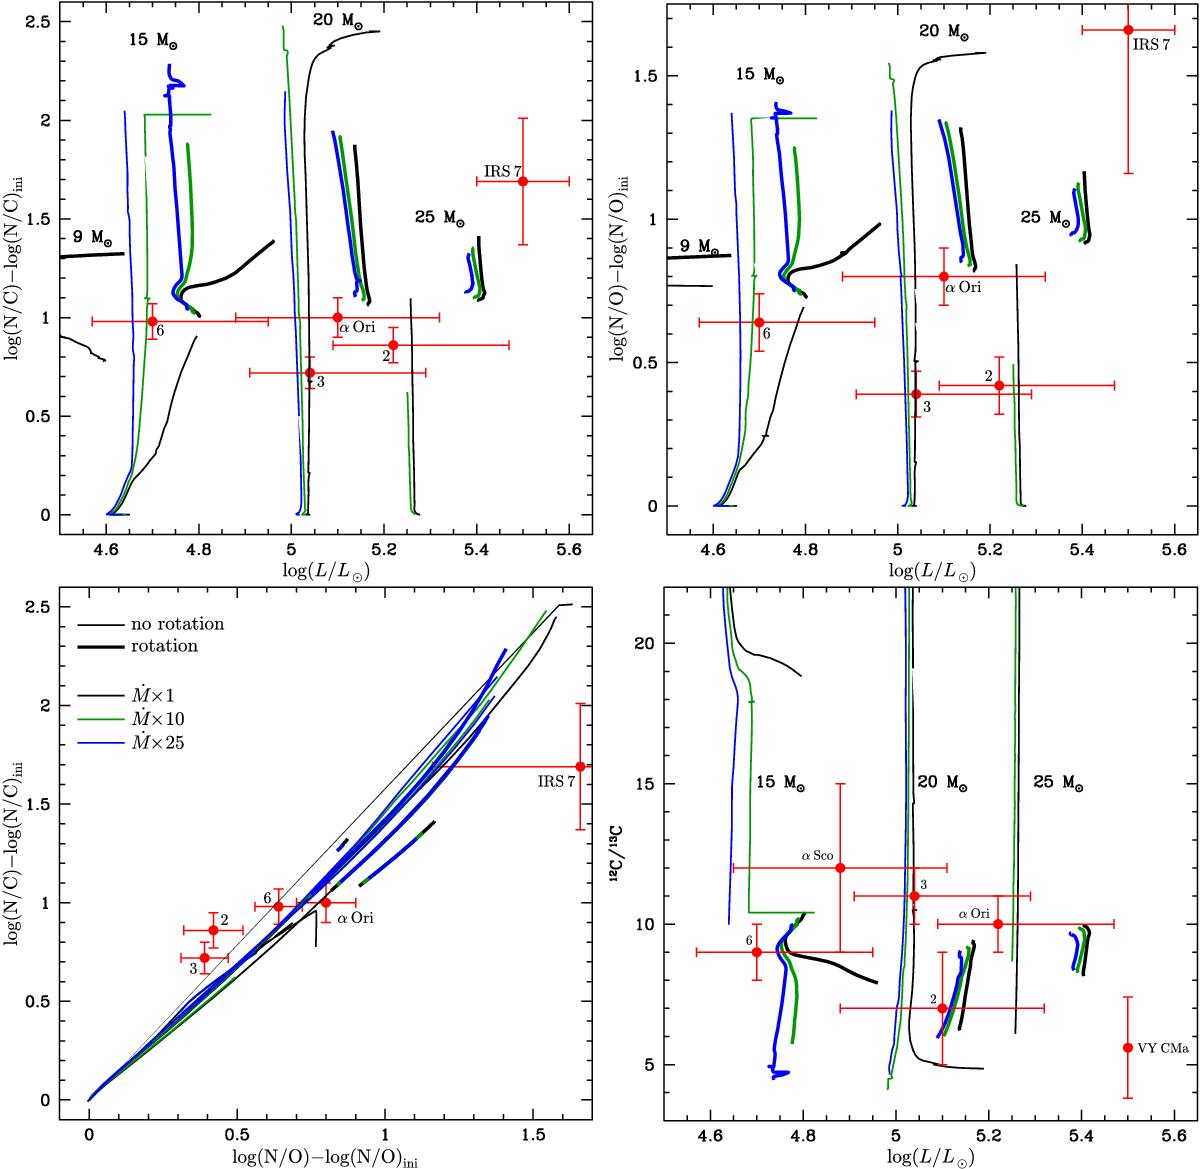
Upper left panel: surface N/C ratios during the RSG phase normalized to the initial ratio in logarithm and in mass fraction as a function of the luminosity for various models. The red full dots are for observed values; stars labeled 2, 3, and 6 are taken from Origlia et al. (2013), α Ori from Lambert et al. (1984), and IRS 7 from Carr et al. (2000). Upper right panel: same as upper left panel, but for the N/O surface abundance ratio. Lower left panel: tracks during the RSG phase in the N/C versus N/O plane (surface values). The models are the same as in the upper left figure. Lower right panel: surface 12C/13C ratios for the same models as in the upper left figure. The dots are observed values for 6, α Sco (Hinkle et al. 1976), 3, 2, alpha Ori, and VY CMa (Matsuura et al. 2014).
Current usage metrics show cumulative count of Article Views (full-text article views including HTML views, PDF and ePub downloads, according to the available data) and Abstracts Views on Vision4Press platform.
Data correspond to usage on the plateform after 2015. The current usage metrics is available 48-96 hours after online publication and is updated daily on week days.
Initial download of the metrics may take a while.