Fig. 5
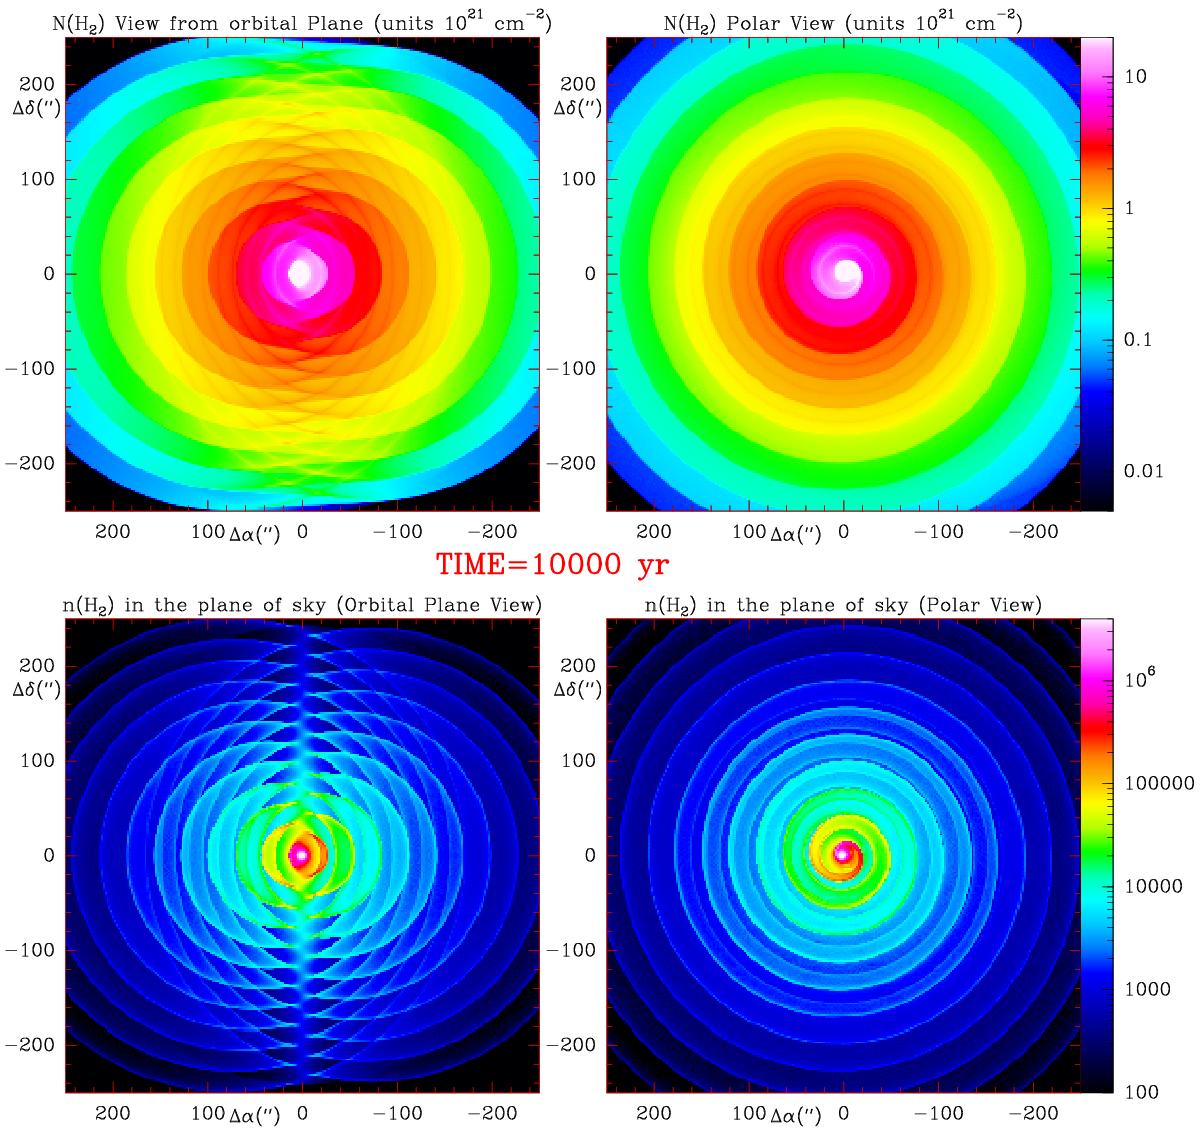
Top panels: H2 column density distribution after 104 yr of constant mass loss for the model described in the text. The column density is integrated over all velocities. The right panel corresponds to a polar view of the CSE (line of sight perpendicular to the orbital plane) and the left panel to a view from the orbital plane. Bottom panels: H2 volume density in the plane of the sky for the same views. The figure corresponds to the last frame of a video showing the time growth of the CSE (online).
Current usage metrics show cumulative count of Article Views (full-text article views including HTML views, PDF and ePub downloads, according to the available data) and Abstracts Views on Vision4Press platform.
Data correspond to usage on the plateform after 2015. The current usage metrics is available 48-96 hours after online publication and is updated daily on week days.
Initial download of the metrics may take a while.