Fig. 12
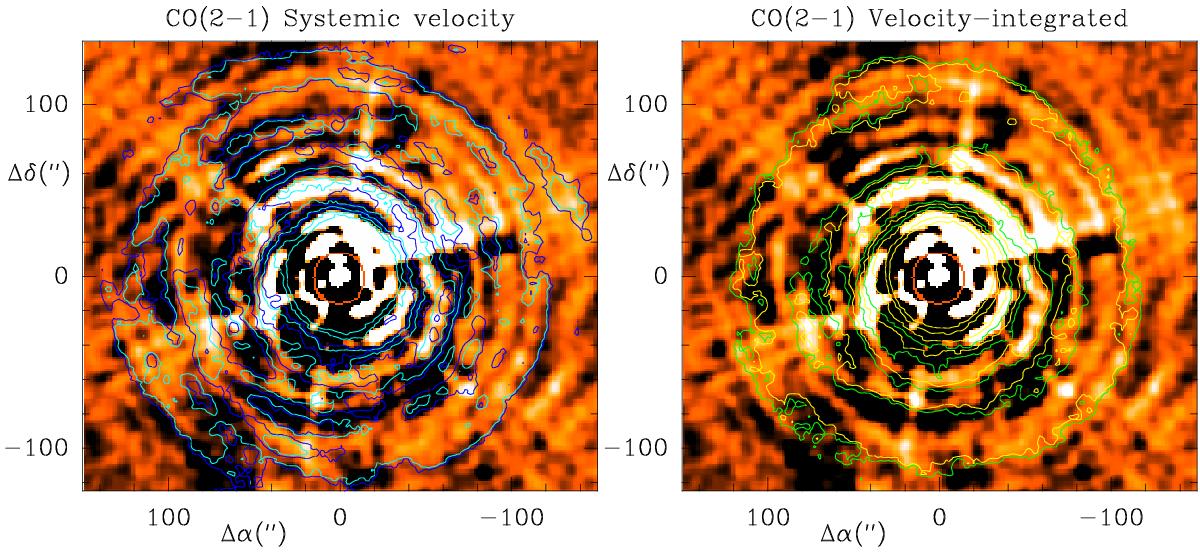
Contour levels of the CO(2−1) line intensity superimposed on the PSF-deconvolved, halo-subtracted 100 μm map of PACS (Fig. 2 of Decin et al. 2011). (Left: CO in the velocity interval (V − V∗) = ± 2 km s-1; right CO integrated over all velocities). Light blue contours levels: 1 to 6 K by steps of 1 K, yellow contours: 10 to 70 K km s-1 by 1 K km s-1. The dark blue contour levels represent 0.9 times the adjacent light blue contour levels and the green contours 0.85 times the adjacent yellow contours.
Current usage metrics show cumulative count of Article Views (full-text article views including HTML views, PDF and ePub downloads, according to the available data) and Abstracts Views on Vision4Press platform.
Data correspond to usage on the plateform after 2015. The current usage metrics is available 48-96 hours after online publication and is updated daily on week days.
Initial download of the metrics may take a while.