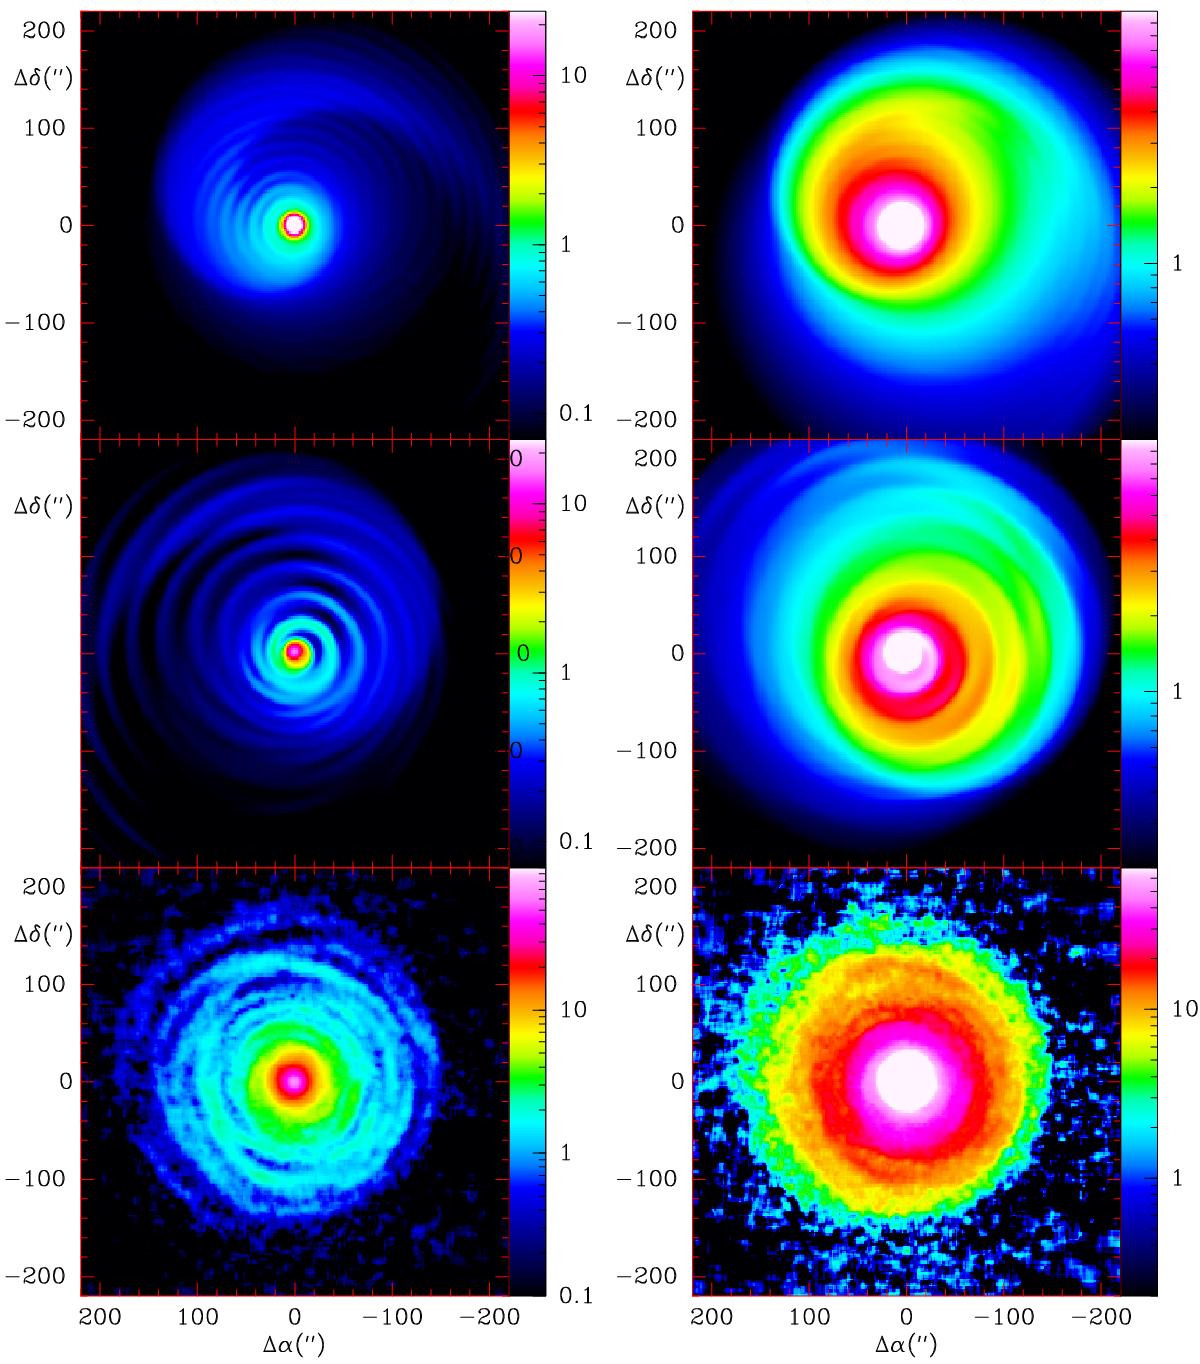
Fig. 11

Gas distribution at t = 10 000 yr for an enhanced mass loss with periods of 400 yr (upper panels) and 800 yr (middle panels), compared to the observed CO(2−1) line brightness distribution (lower panel). The model data have been convolved with a Gaussian of width equal to the telescope HPBW. The left panels show the distribution of the gas for velocities (V − V∗) = ± 2 km s-1 and the right panels the gas column density integrated over all velocities.
Current usage metrics show cumulative count of Article Views (full-text article views including HTML views, PDF and ePub downloads, according to the available data) and Abstracts Views on Vision4Press platform.
Data correspond to usage on the plateform after 2015. The current usage metrics is available 48-96 hours after online publication and is updated daily on week days.
Initial download of the metrics may take a while.


