Fig. 1
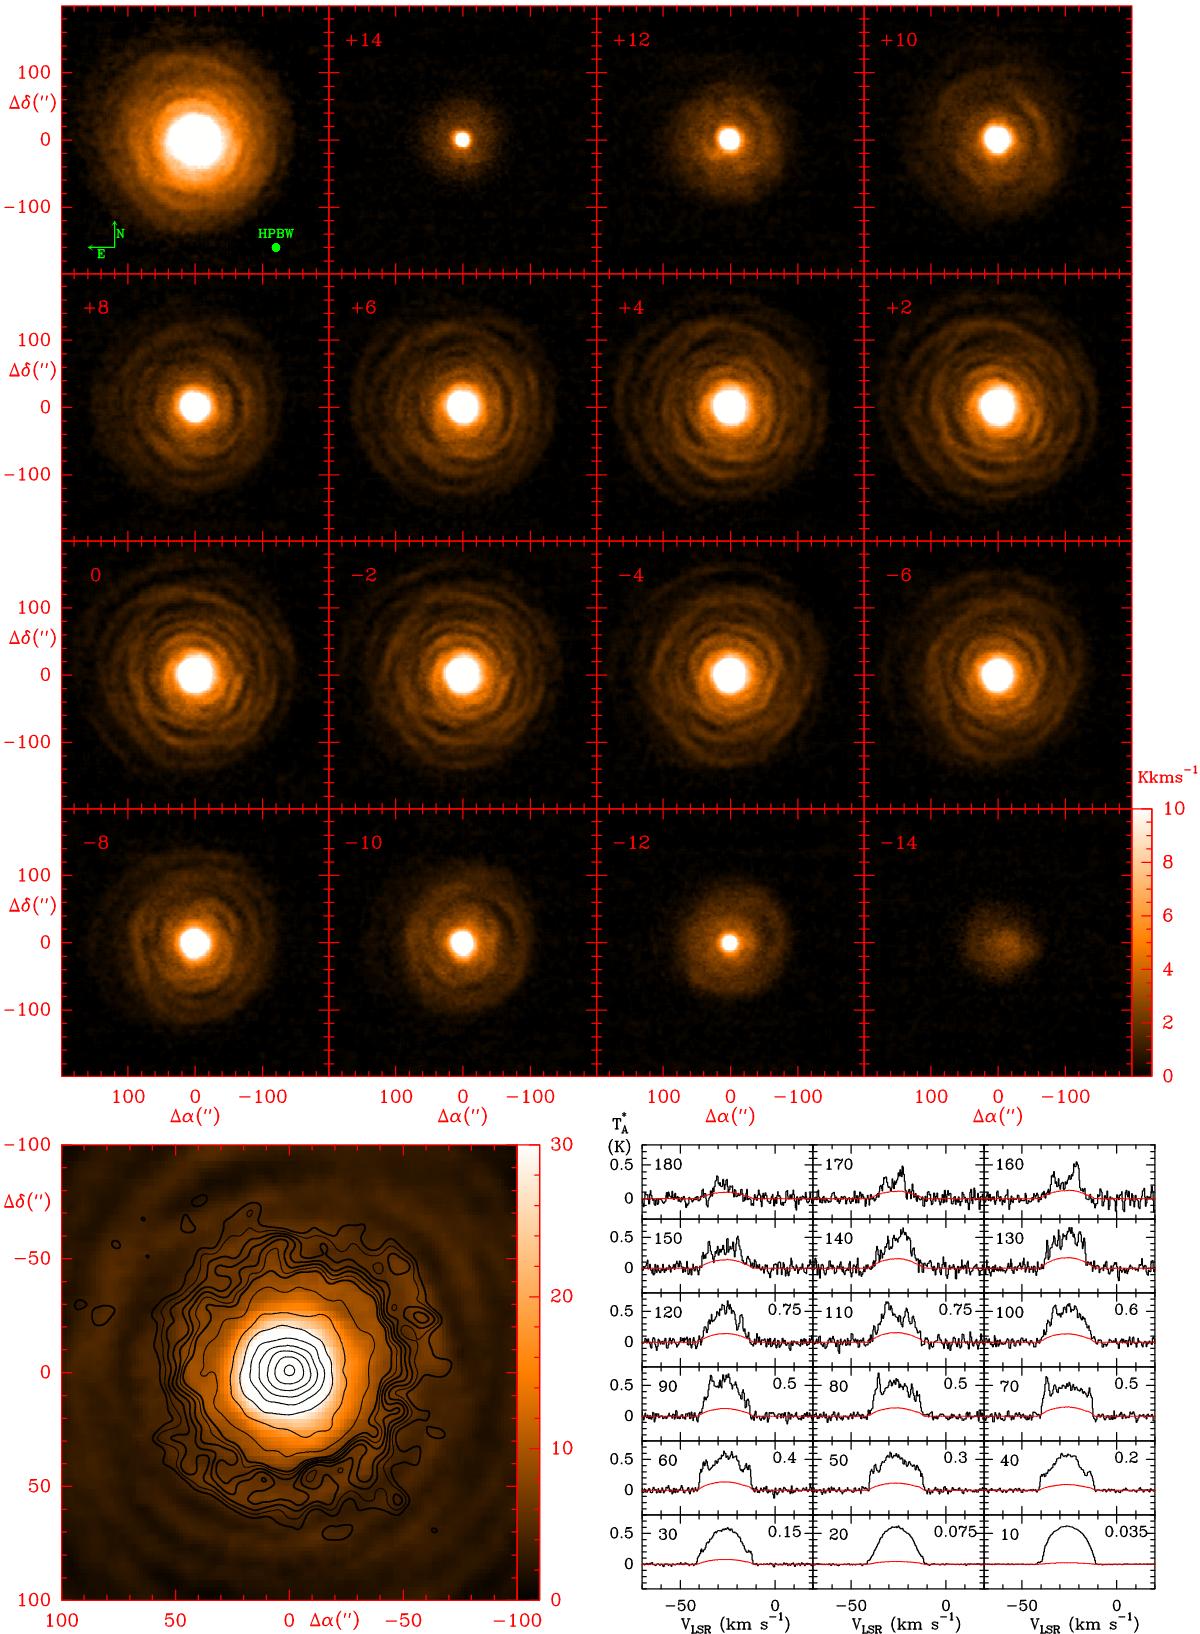
Top left box: velocity-integrated CO (J = 2−1) line emission in the central 400′′ × 400′′ area (VLSR range from −41 to −12 km s-1). Other upper maps: velocity-channel maps (resolution 2 km s-1); marked velocities are relative to the LSR systemic star velocity (V∗ = −26.5 km s-1); the units of the color scale correspond to K km s-1. Positive and negative velocities correspond to the rear and front parts of the envelope, respectively. Bottom right panels: observed 12CO(2−1) line profiles along a strip to the east for Δδ = 0′′; the upper left numbers indicate Δα in arcseconds and the upper right numbers the intensity scaling factor applied to plot all spectra at the same ![]() scale (in K). The contribution of the telescope error beam has been removed from the data and is shown in red for each spectrum. Bottom left panel: the 13CO (2−1) line emission integrated between VLSR−28.5 and −24.5 km s-1 (black contours) superimposed on the 12CO emission in the same velocity range. Note that the r = 50′′ shell also appears in 13CO. The inner shells are not resolved by the 11′′ beam.
scale (in K). The contribution of the telescope error beam has been removed from the data and is shown in red for each spectrum. Bottom left panel: the 13CO (2−1) line emission integrated between VLSR−28.5 and −24.5 km s-1 (black contours) superimposed on the 12CO emission in the same velocity range. Note that the r = 50′′ shell also appears in 13CO. The inner shells are not resolved by the 11′′ beam.
Current usage metrics show cumulative count of Article Views (full-text article views including HTML views, PDF and ePub downloads, according to the available data) and Abstracts Views on Vision4Press platform.
Data correspond to usage on the plateform after 2015. The current usage metrics is available 48-96 hours after online publication and is updated daily on week days.
Initial download of the metrics may take a while.