Fig. 4
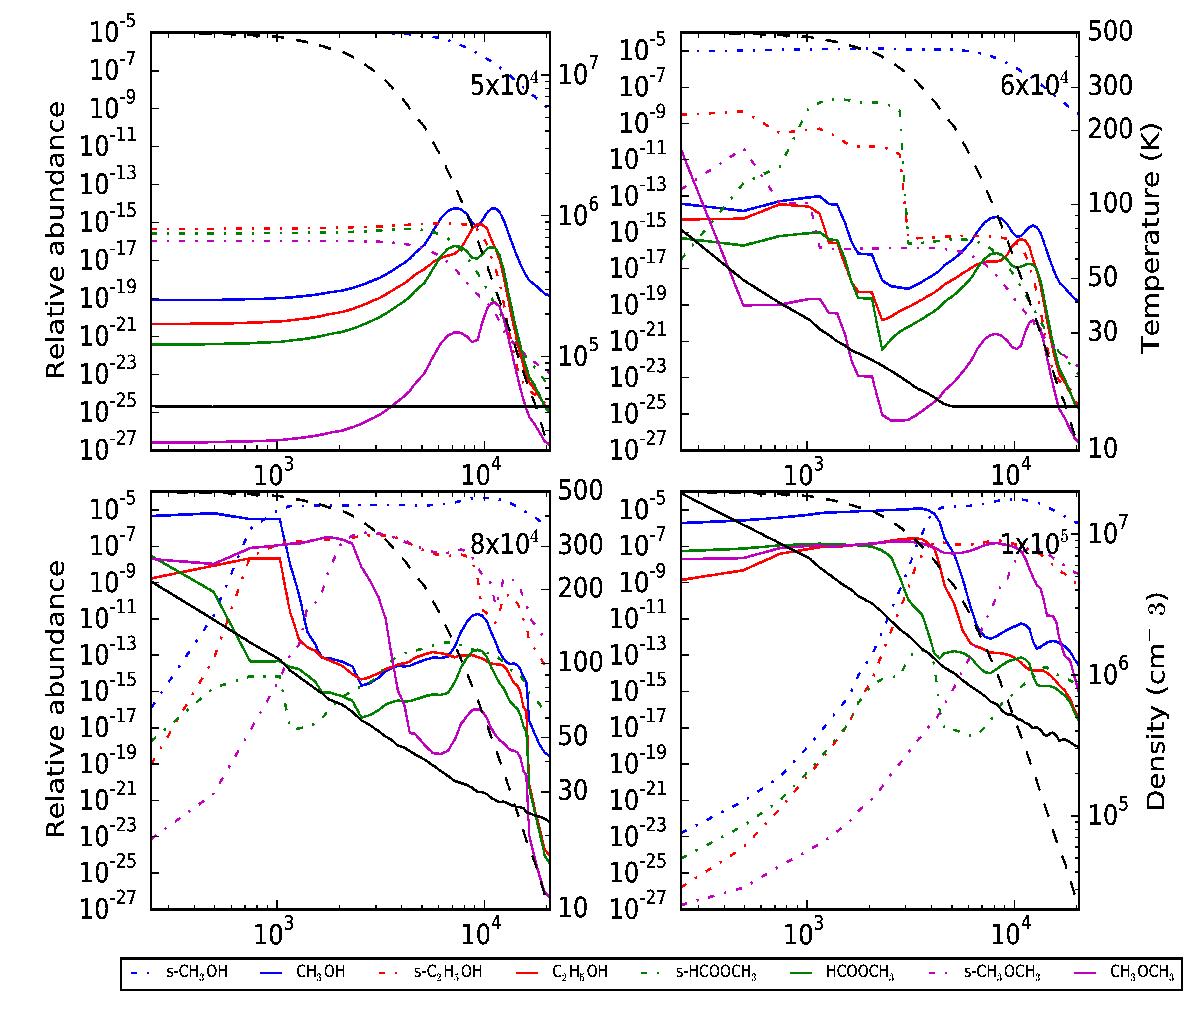
Spatio-temporal abundance variation of selected COMs on the grain (dot-dashed line) and in gas phases (continuous line) are shown for the hot core model cr16-r3-l2. Black dashed and continuous lines show the radial variation of the density and the temperature respectively. Time-stamps (in year) for different temporal snapshots are annotated in the upper right corner of the respective plots. Note the alternative labeling of the density and temperature axes on the right side of the respective plots.
Current usage metrics show cumulative count of Article Views (full-text article views including HTML views, PDF and ePub downloads, according to the available data) and Abstracts Views on Vision4Press platform.
Data correspond to usage on the plateform after 2015. The current usage metrics is available 48-96 hours after online publication and is updated daily on week days.
Initial download of the metrics may take a while.