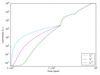
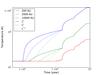
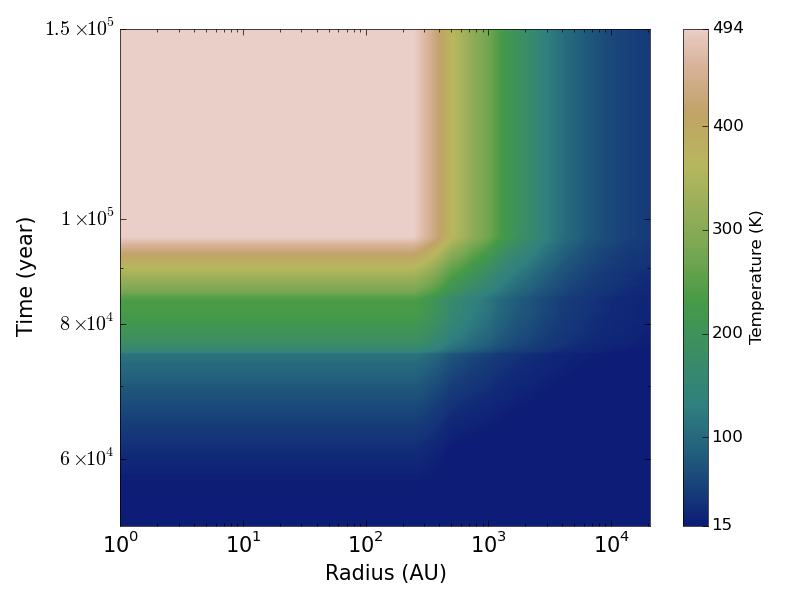
Fig. 3
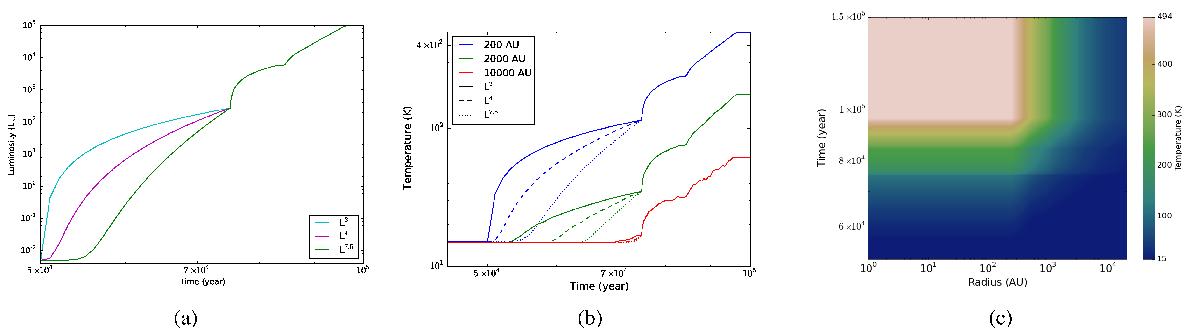
a) Luminosity evolution profiles for different power-law indices. b) Temperature evolution in the hot core model hmc-r3 at different radii: ~200 AU (blue), ~2000 AU (green) and ~10 000 AU (red). Temperature distribution obtained using different protostellar luminosity evolutions are shown with continuous (l2), dashed (l4), and dotted (l7) lines. c) Spatio-temporal evolution of the temperature in the hot core model hmc-r3.
Current usage metrics show cumulative count of Article Views (full-text article views including HTML views, PDF and ePub downloads, according to the available data) and Abstracts Views on Vision4Press platform.
Data correspond to usage on the plateform after 2015. The current usage metrics is available 48-96 hours after online publication and is updated daily on week days.
Initial download of the metrics may take a while.