Free Access
Fig. E.1
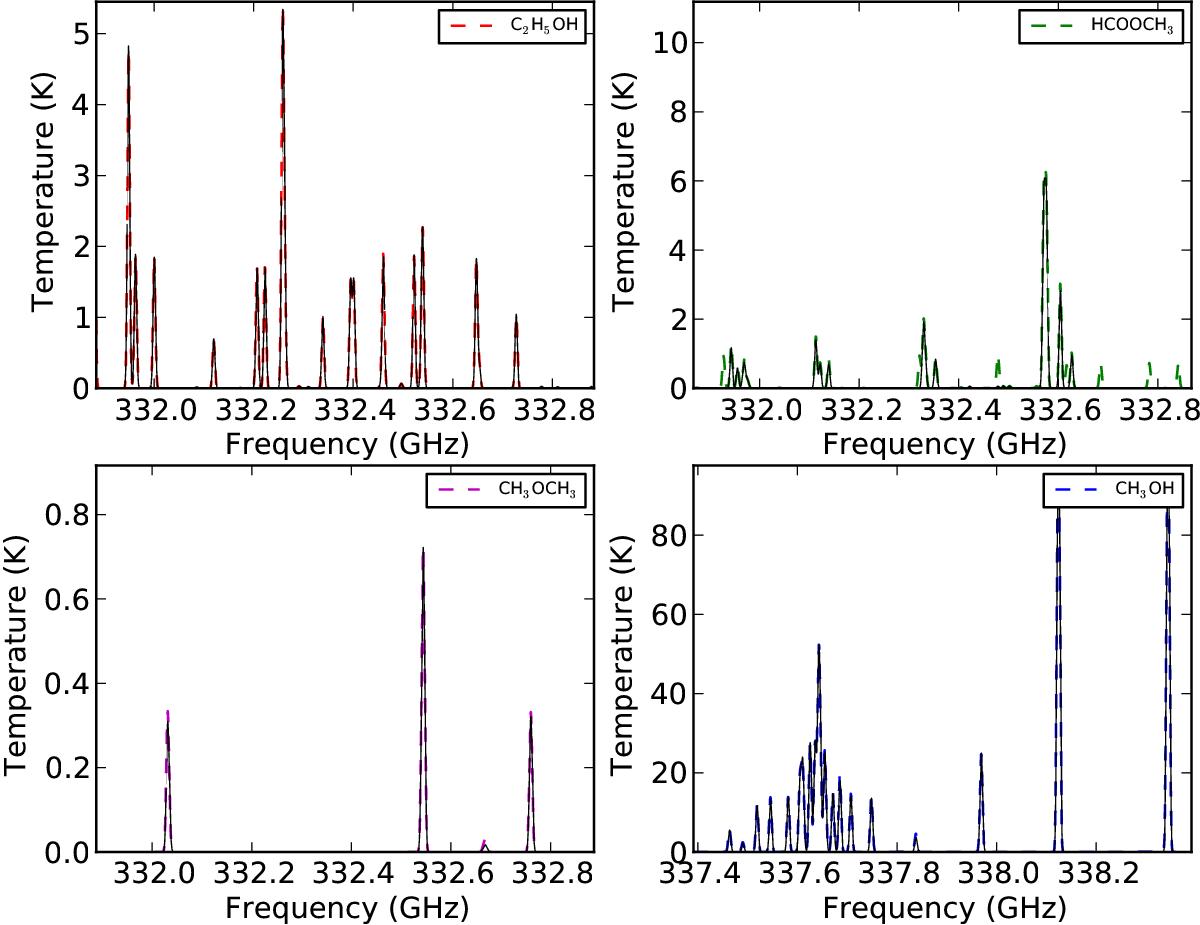
Fitted spectra obtained from the myXCLASS analysis (solid black line), overplotted on the simulated spectra (colored dashed lines) of different COMs.
Current usage metrics show cumulative count of Article Views (full-text article views including HTML views, PDF and ePub downloads, according to the available data) and Abstracts Views on Vision4Press platform.
Data correspond to usage on the plateform after 2015. The current usage metrics is available 48-96 hours after online publication and is updated daily on week days.
Initial download of the metrics may take a while.