Fig. C.1
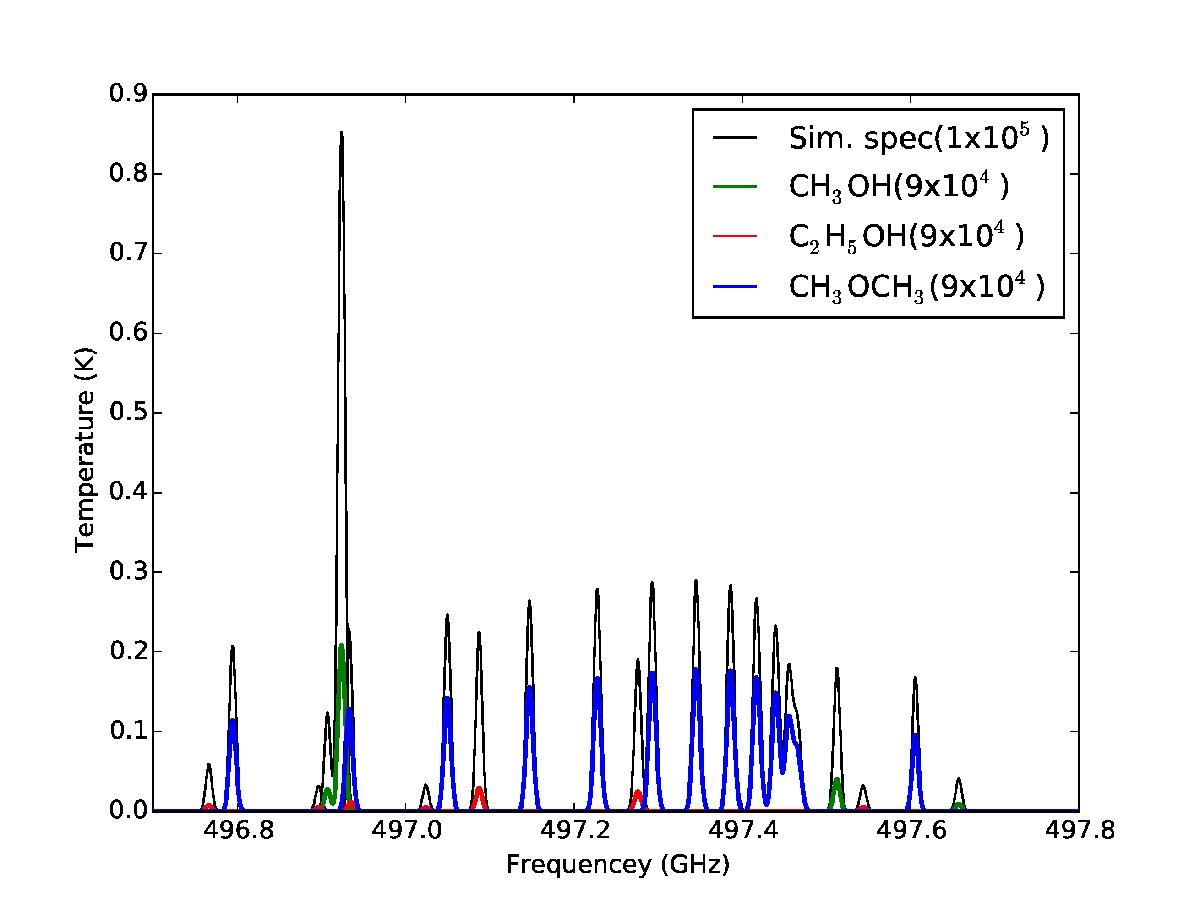
Simulated spectra for the hot core model cr16-r3-l7 at 9 × 10⁴ year, overplotted on the spectra at 1 × 10⁵ year. The intensity of various spectral lines at two different epochs cannot be matched using a scaling factor. Spectral changes originate from the variation of temperature and abundances at different timescales.
Current usage metrics show cumulative count of Article Views (full-text article views including HTML views, PDF and ePub downloads, according to the available data) and Abstracts Views on Vision4Press platform.
Data correspond to usage on the plateform after 2015. The current usage metrics is available 48-96 hours after online publication and is updated daily on week days.
Initial download of the metrics may take a while.