Fig. B.1
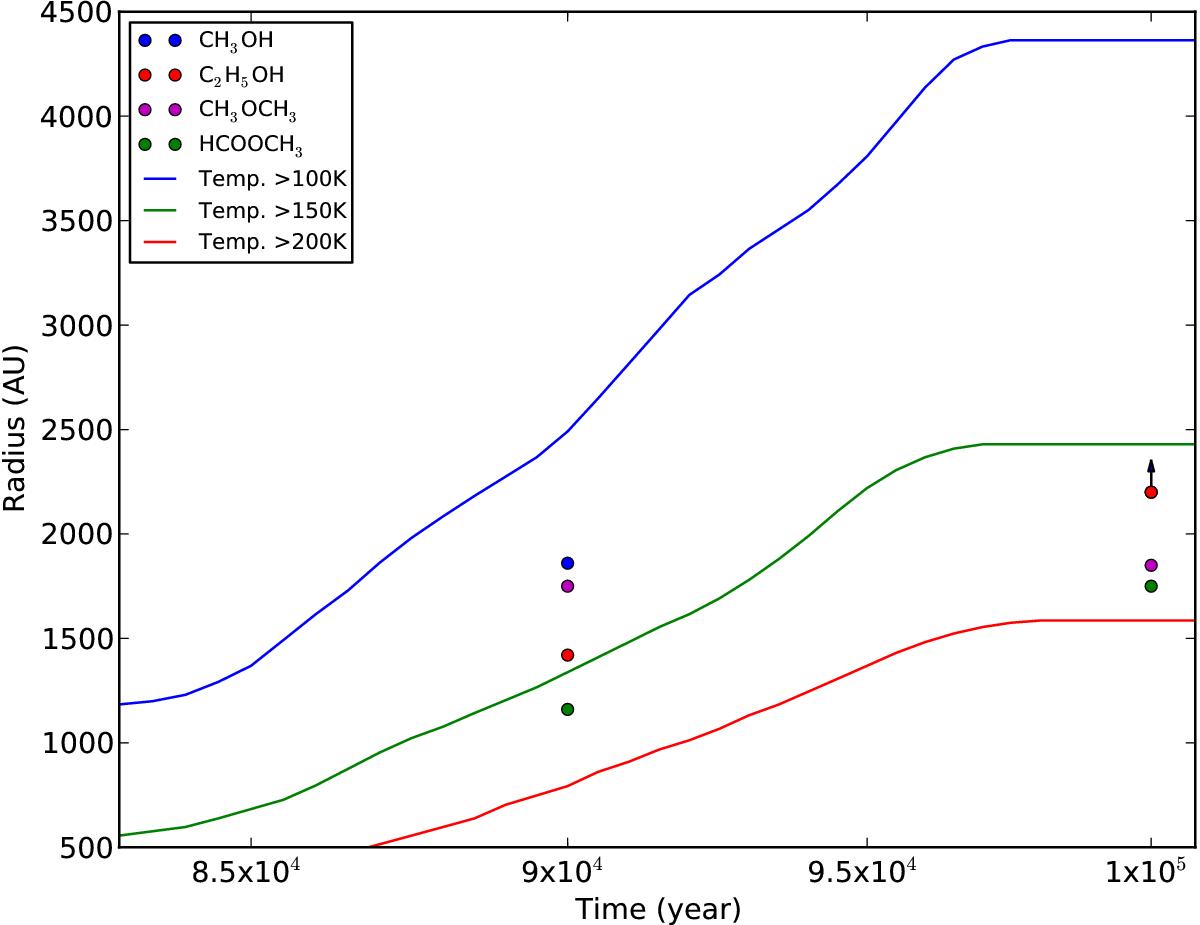
Temporal variation of the radii with temperature above 100 K, 150 K, and 200 K. Radii of the spatial distribution of various molecules as derived from the myXCLASS analysis (see Table 7) are overplotted with different colors. The arrow indicates that the radii of CH3OH and C2H5OH at 1 × 10⁵ year are only lower limits.
Current usage metrics show cumulative count of Article Views (full-text article views including HTML views, PDF and ePub downloads, according to the available data) and Abstracts Views on Vision4Press platform.
Data correspond to usage on the plateform after 2015. The current usage metrics is available 48-96 hours after online publication and is updated daily on week days.
Initial download of the metrics may take a while.