Fig. 9
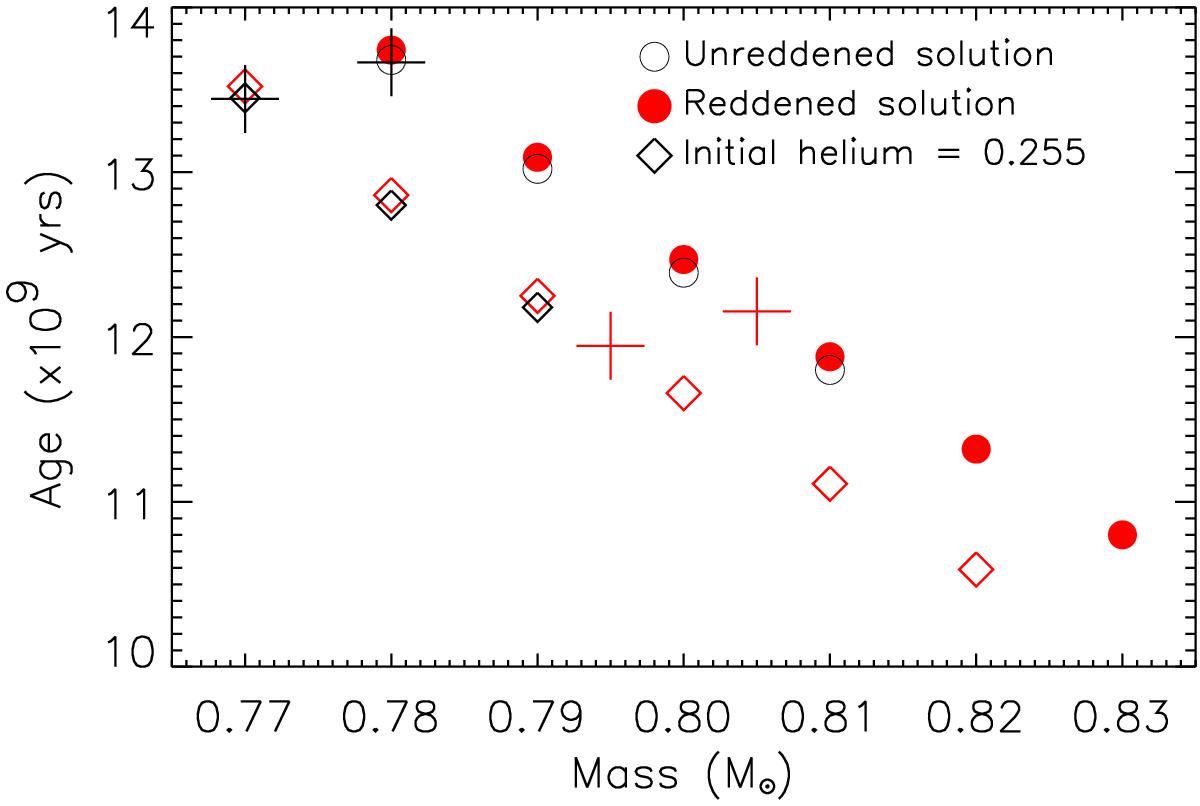
Relationship between the age and the mass of the models that satisfies the observational constraints. The circles/diamonds correspond to the Yi = 0.245 / 0.255 solution, and the red denotes the AV = 0.10 mag solution. The crosses denote the values corresponding to the centres of the error boxes in the HR diagram (Fig. 8) and the solutions given in Table 12. See Sect. 7.3.4 for details.
Current usage metrics show cumulative count of Article Views (full-text article views including HTML views, PDF and ePub downloads, according to the available data) and Abstracts Views on Vision4Press platform.
Data correspond to usage on the plateform after 2015. The current usage metrics is available 48-96 hours after online publication and is updated daily on week days.
Initial download of the metrics may take a while.