Fig. 8
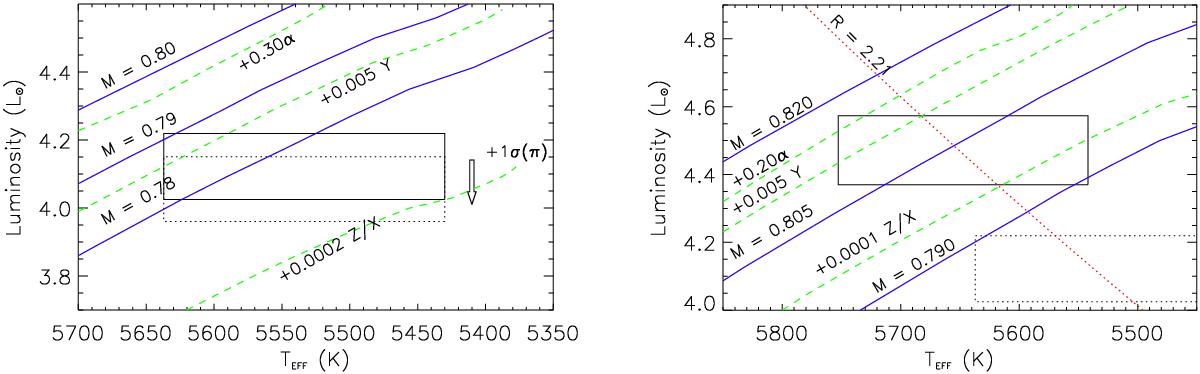
HR diagrams illustrating the error box corresponding to the observations derived in this work for HD 140283. The left and right panels show the results when we adopt AV = 0.00 and 0.10 mag. The dotted box in the left panel shows the error box when the distance is increased by 1σ, also illustrated by the arrow. In the right panel (non-zero reddening solution) we also show the AV = 0.00 error box (dotted box), located in the lower right part of the figure. The central models correspond to Yi = 0.245,α = 1.00, and Z/Xi = 0.0005 (with Reν = 5). The optimal masses are M = 0.780 and M = 0.805M⊙, and are shown as the blue continuous lines passing near the centre of the error boxes. We also illustrate other models by changing the mass (blue) and the other parameters (green). The red dotted line corresponds to the radius derived in this paper. See Sect. 7.3 for details.
Current usage metrics show cumulative count of Article Views (full-text article views including HTML views, PDF and ePub downloads, according to the available data) and Abstracts Views on Vision4Press platform.
Data correspond to usage on the plateform after 2015. The current usage metrics is available 48-96 hours after online publication and is updated daily on week days.
Initial download of the metrics may take a while.