Fig. 4
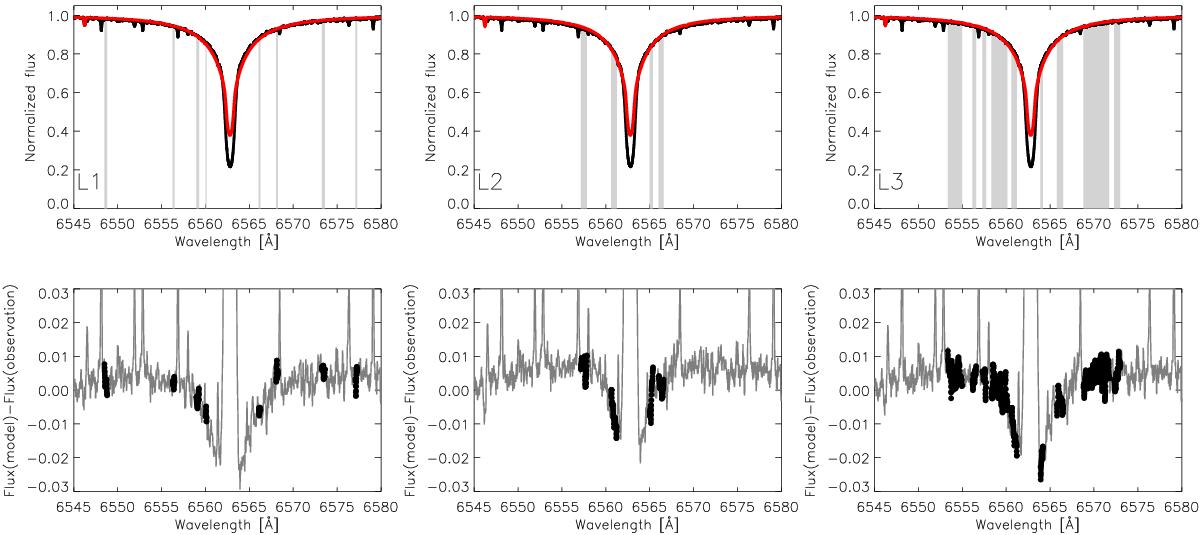
Top: observed NARVAL spectrum (black) of the H-α profile of HD 140283 and fitted spectrum (red) using the three narrow continuum masks (shaded regions) for log g = 3.65 and [Fe/H] = –2.46. Bottom: residuals between the observed and fitted spectrum for each line mask, with the black dots indicating the line masks. See Sect. 5 for details.
Current usage metrics show cumulative count of Article Views (full-text article views including HTML views, PDF and ePub downloads, according to the available data) and Abstracts Views on Vision4Press platform.
Data correspond to usage on the plateform after 2015. The current usage metrics is available 48-96 hours after online publication and is updated daily on week days.
Initial download of the metrics may take a while.