Free Access
Fig. 1
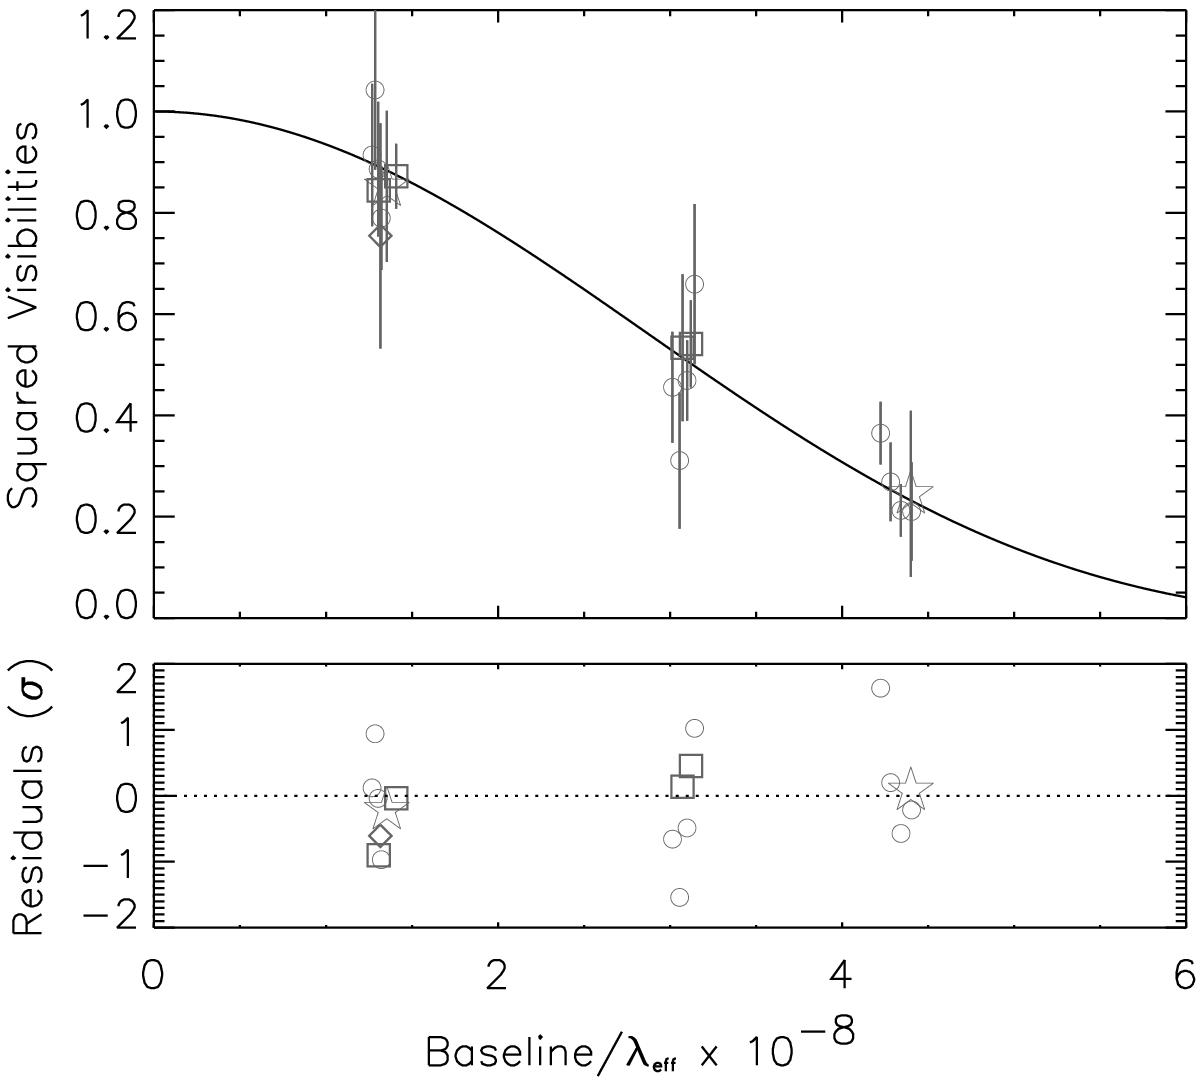
Top: squared visibility measurements and the fitted visibility curve corresponding to a 1D diameter θ1D = 0.353 mas. Bottom: data residuals scaled by the errors on the measurements. The symbols represent the night the data were taken: ⋄ = 2012 April 18, °= 2012 May 21, □= 2014 May 03, and ⋆ = 2014 May 04 (Sect. 2.2.2).
Current usage metrics show cumulative count of Article Views (full-text article views including HTML views, PDF and ePub downloads, according to the available data) and Abstracts Views on Vision4Press platform.
Data correspond to usage on the plateform after 2015. The current usage metrics is available 48-96 hours after online publication and is updated daily on week days.
Initial download of the metrics may take a while.