Fig. 11
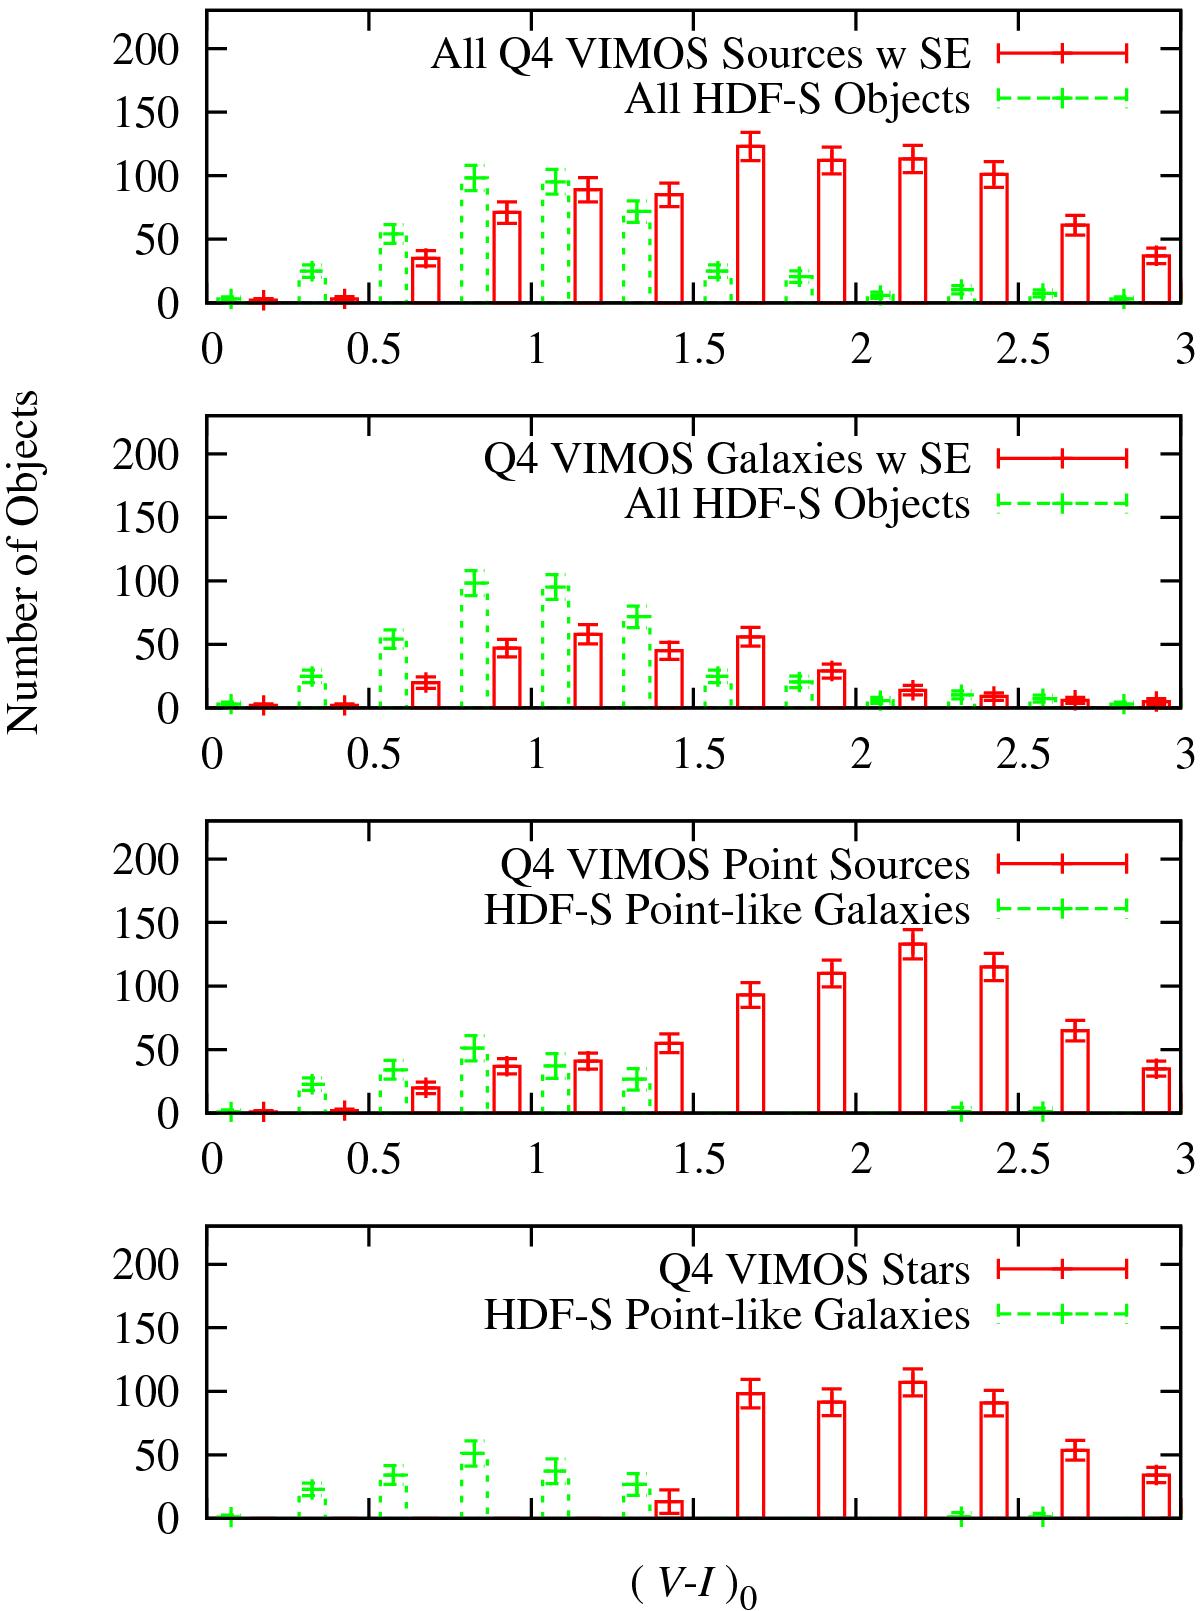
Estimation of the unresolved galaxy contamination rate in the VIMOS data with 23.9 <I0 < 24.7 as a function of (V − I)0 color. Poisson distribution errors in number counts are shown. Incompleteness has not been corrected for either VIMOS or ground-based HDF-S. The histograms are of objects in color bins of width Δ((V − I)0 = 0.25) and are scaled to the field of view for one 36.6 square arcminute quadrant of our VIMOS data. First panel from the top: all sources from VIMOS Quadrant 4 as found by Source Extractor version 2.5 (Bertin & Arnouts 1996; red histogram) and the objects from the ground-based observations by da Costa et al. (1998) of the HST Hubble Deep Field South (HDF-S; Williams et al. 2000; dashed green histogram). Second panel from the top: extended sources in VIMOS Quadrant 4 found using Source Extractor (red histogram) and again the objects from the ground-based observations of HDF-S (dashed green histogram). Third panel from the top: the point sources from our VIMOS data as the red histogram. The dashed green histogram shows the difference between the histograms in the second panel. Last panel: two difference histograms. The red histogram shows the difference between the two histograms in the first panel. The dashed green histogram is the same as that in the third panel. See Sect. 4.2 for a full discussion of this figure. (See the electronic edition of the journal for a color version of this figure.)
Current usage metrics show cumulative count of Article Views (full-text article views including HTML views, PDF and ePub downloads, according to the available data) and Abstracts Views on Vision4Press platform.
Data correspond to usage on the plateform after 2015. The current usage metrics is available 48-96 hours after online publication and is updated daily on week days.
Initial download of the metrics may take a while.