Fig. 10
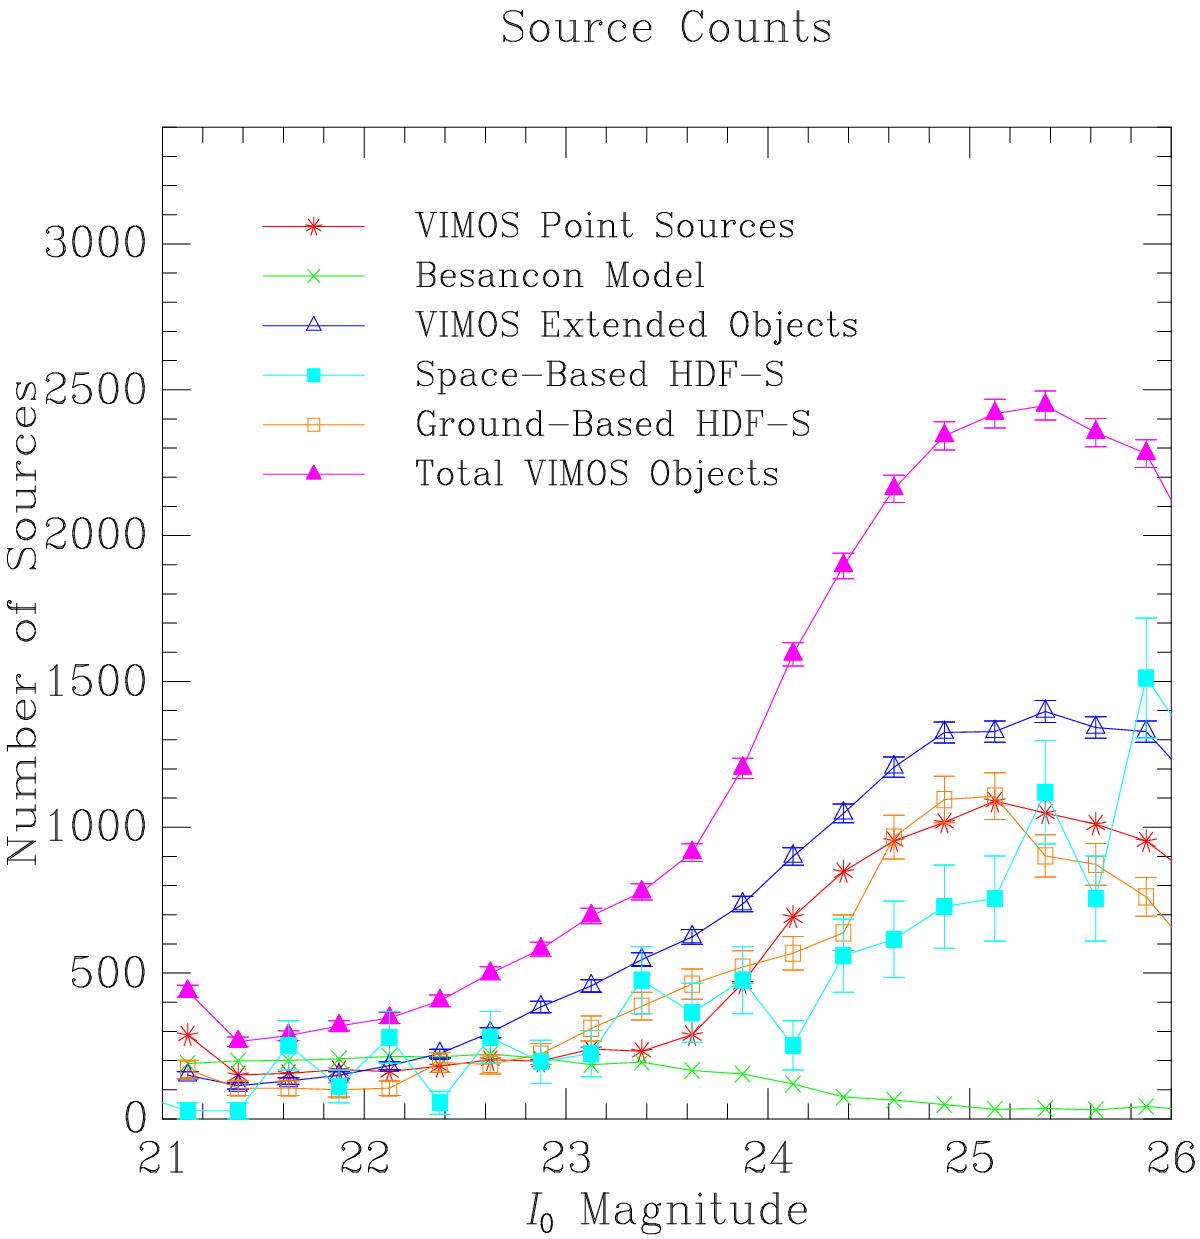
Source counts as a function of apparent I magnitude in our VIMOS data compared to counts in the Besançon model of the Milky Way (Robin et al. 2003), space-based Hubble Deep Field South (HDF-S; Williams et al. 2000; Casertano et al. 2000), and ground-based HDF-S (da Costa et al. 1998). Both HDF-S source counts have been normalized to the field of view of VIMOS. Sources in VIMOS have been additionally subdivided into an upper limit of extended objects (blue open triangles) and point sources (red asterisks), clearly showing that an excess number of sources in our VIMOS field are detected as compared to the sources of both HDF-S fields. The predictions of the Besançon model (green crosses) are in good agreement with the number of point sources in our VIMOS field down to I0 ≈ 23.5, dimmer than which the point sources in the VIMOS field rises rapidly due to a combination of RGB stars in NGC 5128 and rising numbers of unresolved, mainly blue, background galaxies. Ground-based HDF-S (orange open squares) is a comparative example of faint background galaxy observations with similar 50% completeness at I0 = 24.6 as to our VIMOS study of I0 = 24.7. The similarity between VIMOS point source counts (red asterisks), ground-based extended source counts in the field of NGC 5128 (open blue triangles), and ground-based background galaxy counts in the field of HDS-S (open orange squares) shows that further work is needed to discriminate the two populations (cf. Sect. 4.2). Poisson error bars are added for VIMOS total sources and extended objects and for space-based and ground-based HDF-S. Incompleteness has not been corrected. Error bars for VIMOS point sources and the Besançon model are of the same scale as the plotting symbols and are not included. (See the electronic edition of the journal for a color version of this figure.)
Current usage metrics show cumulative count of Article Views (full-text article views including HTML views, PDF and ePub downloads, according to the available data) and Abstracts Views on Vision4Press platform.
Data correspond to usage on the plateform after 2015. The current usage metrics is available 48-96 hours after online publication and is updated daily on week days.
Initial download of the metrics may take a while.