Fig. 8
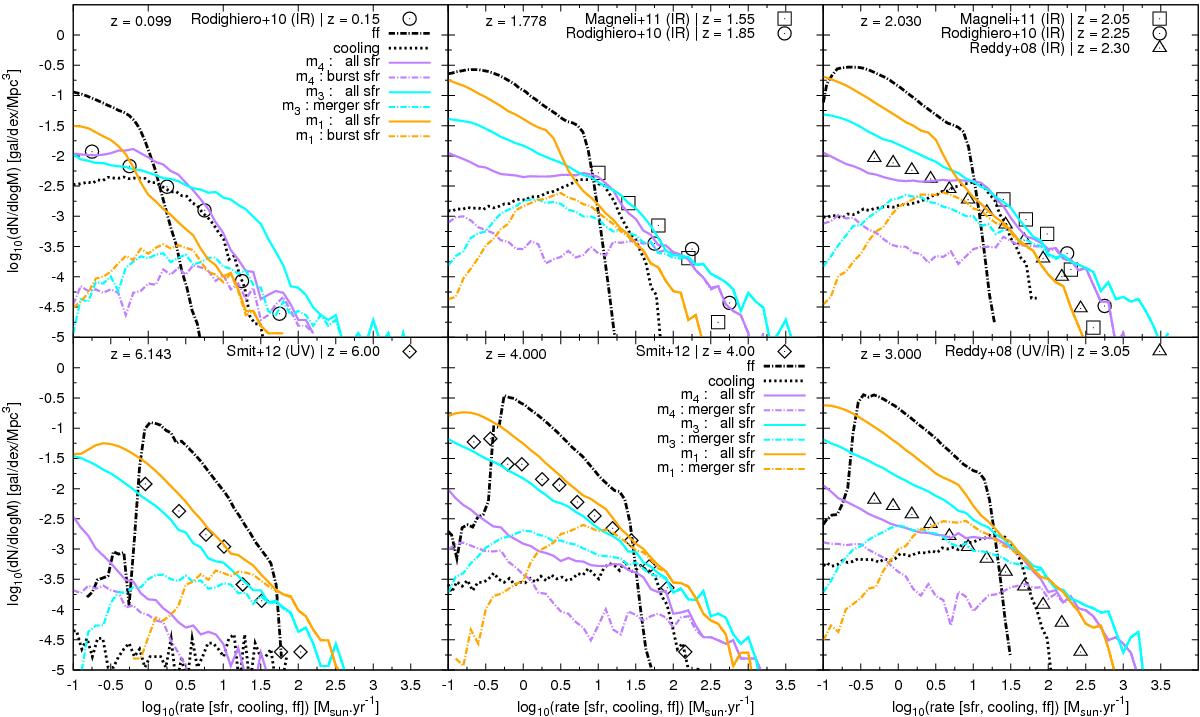
Star formation rate distribution for m1, m3, and m4. Solid and dot-dashed coloured lines give the total and the merger-induced (Eq. (6)) star formation rate distribution, respectively. The merger-induced distributions are built with galaxies that i) have merged during the last time-step and ii) have ![]() , where
, where ![]() and σSFR are, respectively, the mean and standard deviation of star formation rate distribution of steady-state galaxies with stellar mass and dark matter halo mass value close (in the same half dex) to the merger-driven starburst galaxy taken into account. Models are compared with a set of observational data coming from Rodighiero et al. (2010; circles), Magnelli et al. (2011; squares) and Reddy et al. (2008; triangles) at low redshift (z ≤ 3), and from Smit et al. (2012; diamonds) at high redshift (z = 4−6). For information we add the free-fall rate (black dash-dot line) and cooling rate (black dot line) distribution function for model m4.
and σSFR are, respectively, the mean and standard deviation of star formation rate distribution of steady-state galaxies with stellar mass and dark matter halo mass value close (in the same half dex) to the merger-driven starburst galaxy taken into account. Models are compared with a set of observational data coming from Rodighiero et al. (2010; circles), Magnelli et al. (2011; squares) and Reddy et al. (2008; triangles) at low redshift (z ≤ 3), and from Smit et al. (2012; diamonds) at high redshift (z = 4−6). For information we add the free-fall rate (black dash-dot line) and cooling rate (black dot line) distribution function for model m4.
Current usage metrics show cumulative count of Article Views (full-text article views including HTML views, PDF and ePub downloads, according to the available data) and Abstracts Views on Vision4Press platform.
Data correspond to usage on the plateform after 2015. The current usage metrics is available 48-96 hours after online publication and is updated daily on week days.
Initial download of the metrics may take a while.