Fig. 6
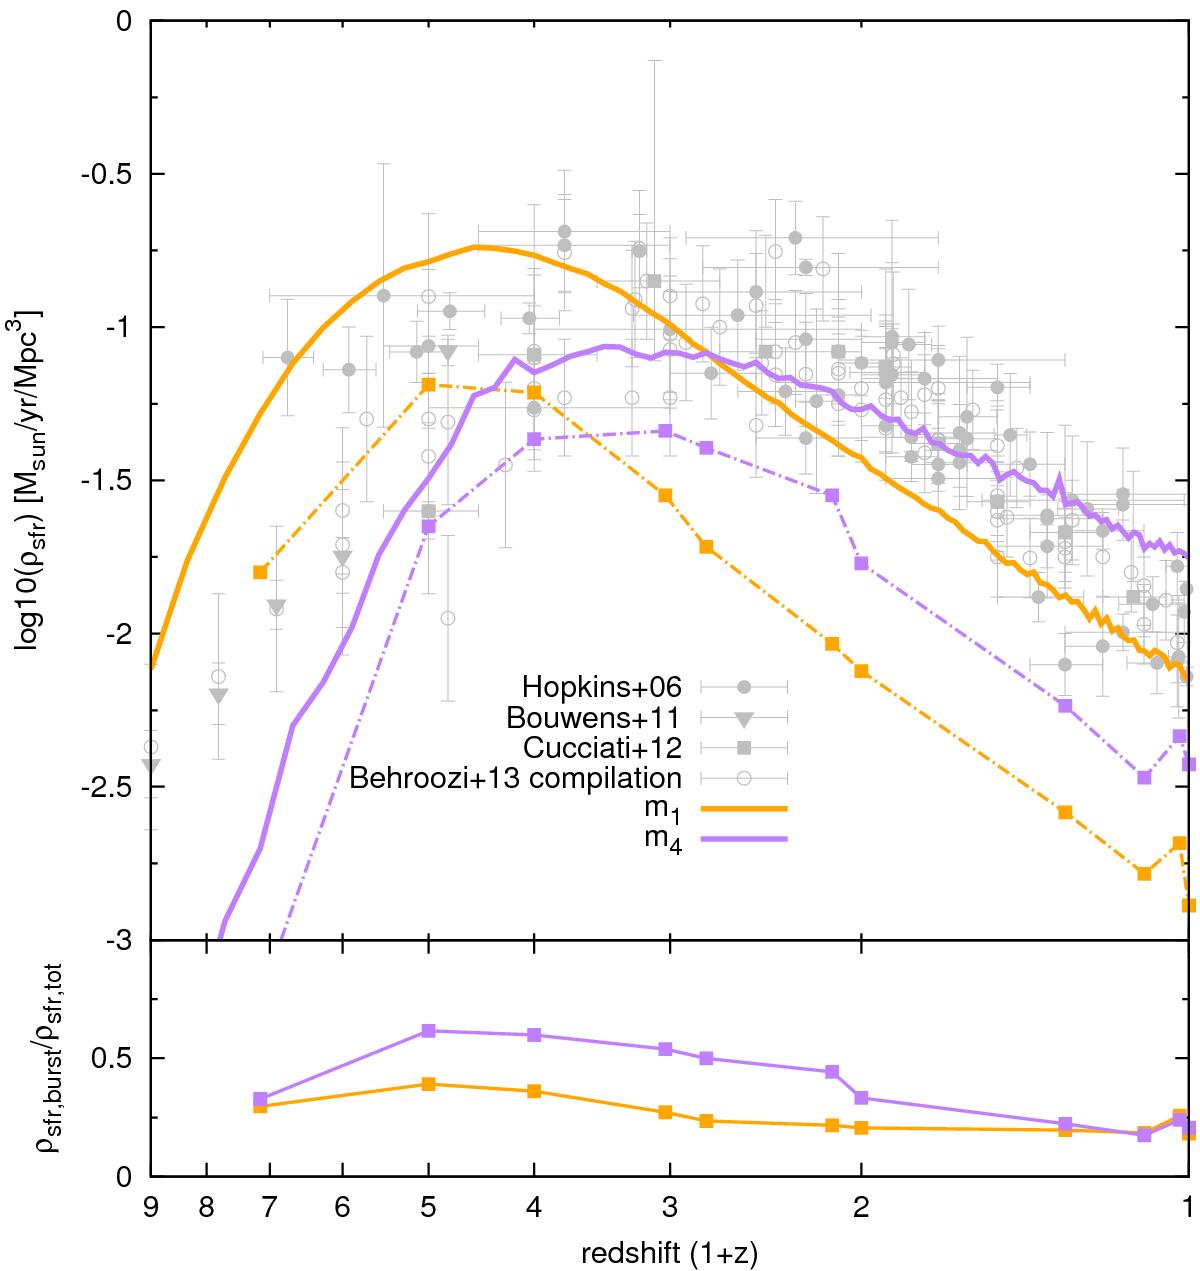
Redshift evolution of the star formation rate density. Model predictions (coloured lines) are compared with observational data (grey points) coming from Hopkins & Beacom (2006), Bouwens et al. (2011), and Cucciati et al. (2012). Solid lines present the star formation rates derived from the models. They are computed as the sum of the star formation rate of all galaxies and divided by the box volume ((100 /h)3 ≃ 1503 Mpc3). Dashed lines show the merger-driven star formation activity. The bottom panel gives the redshift evolution of the ratio ρsfr,burst/ρsfr,tot. We can see that the fraction of star formation activity linked to merger events is larger in m4 than in the reference model m1.
Current usage metrics show cumulative count of Article Views (full-text article views including HTML views, PDF and ePub downloads, according to the available data) and Abstracts Views on Vision4Press platform.
Data correspond to usage on the plateform after 2015. The current usage metrics is available 48-96 hours after online publication and is updated daily on week days.
Initial download of the metrics may take a while.