Fig. 5
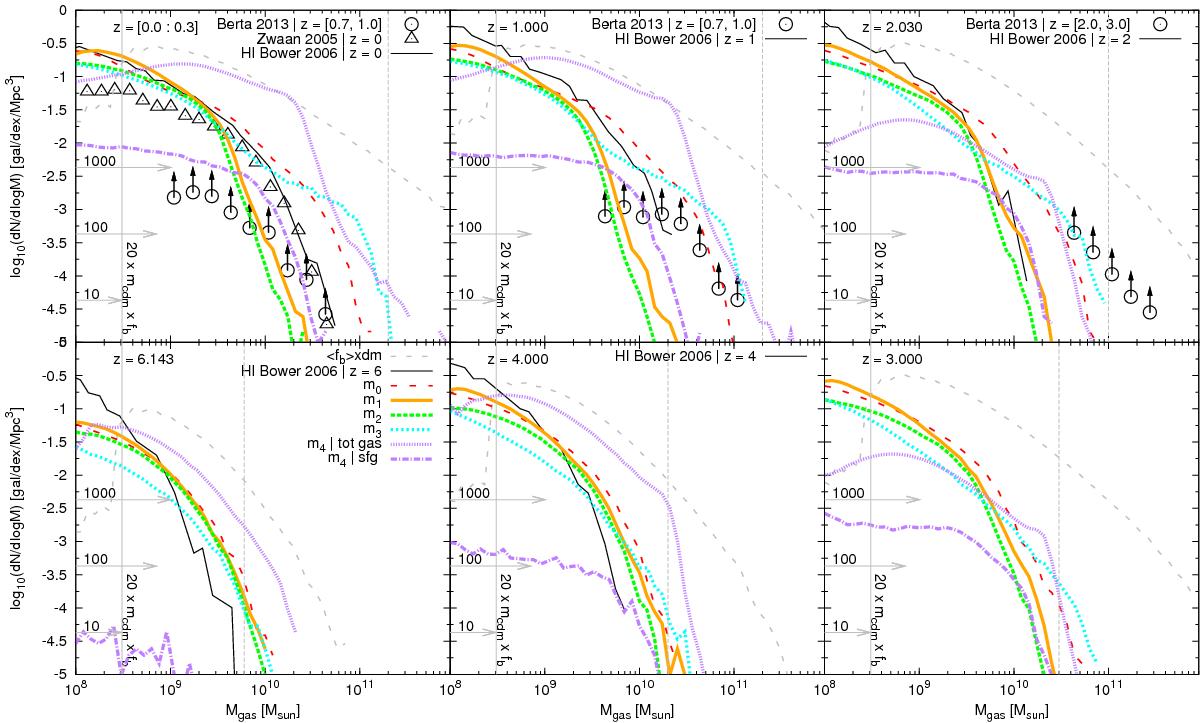
Gas mass functions predicted by our SAMs. The colour code is explained in Table 1. For comparison, we add the extremal gas mass function deduced from the dark-matter mass function and the universal baryonic fraction ⟨fb⟩ (grey dashed-line). In the case of m4, we plot the total (star-forming + no-star-forming) and the star-forming gas mass function. We compare our results with the molecular gas mass function computed by Berta et al. (2013; lower limits, circles) and with the local HI mass function computed by Zwaan et al. (2005; triangles). The black solid line shows the HI mass function predicted by Lagos et al. (2011), using Bower et al. (2006) SAM. The horizontal arrows show the link between the density and the number of haloes in our simulation volume.
Current usage metrics show cumulative count of Article Views (full-text article views including HTML views, PDF and ePub downloads, according to the available data) and Abstracts Views on Vision4Press platform.
Data correspond to usage on the plateform after 2015. The current usage metrics is available 48-96 hours after online publication and is updated daily on week days.
Initial download of the metrics may take a while.