Fig. 3
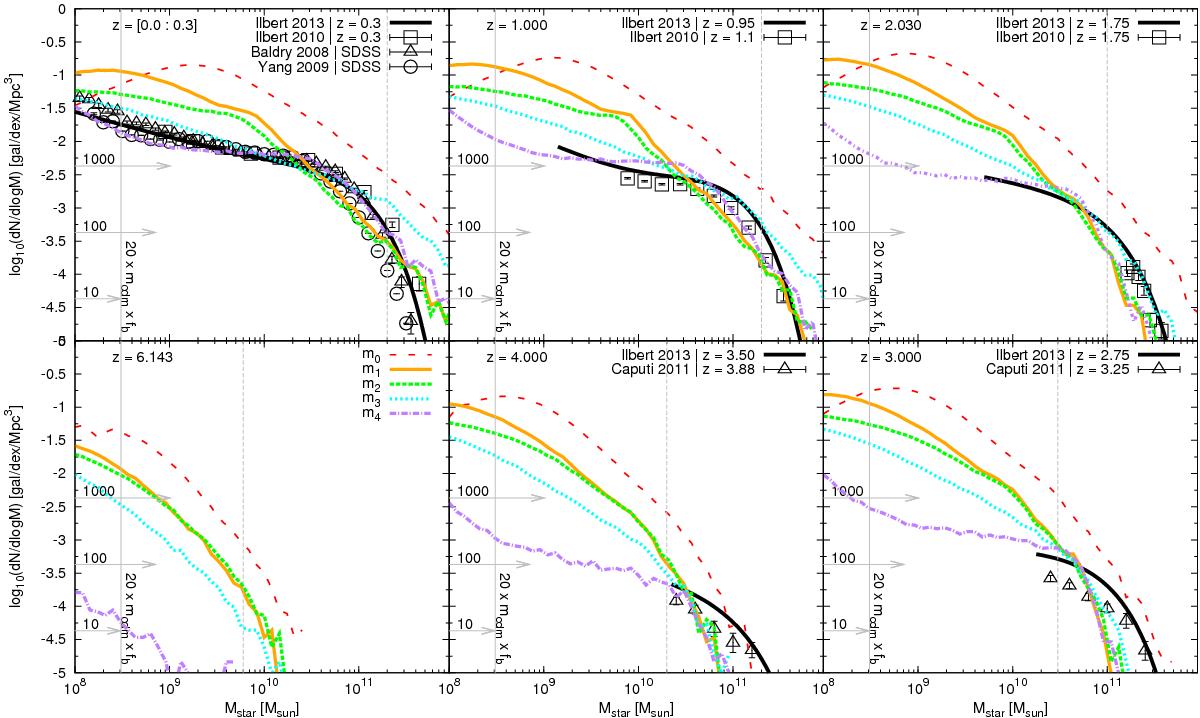
Stellar mass function and its evolution with redshift. The redshift is increasing clockwise. The colour code is the same for all figures, and is detailed in the model list (Table 1). We compare our results with Ilbert et al. (2010, 2013; squares), Yang et al. (2009; circles), Baldry et al. (2008; triangles in the first panel), and Caputi et al. (2011; triangles) observations. Horizontal arrows show the link between the density and the number of haloes in our simulation volume. The grey dashed lines plotted in the high-mass range indicate the limit where uncertainties due to the cosmic variance are equal to the differences between models.
Current usage metrics show cumulative count of Article Views (full-text article views including HTML views, PDF and ePub downloads, according to the available data) and Abstracts Views on Vision4Press platform.
Data correspond to usage on the plateform after 2015. The current usage metrics is available 48-96 hours after online publication and is updated daily on week days.
Initial download of the metrics may take a while.