Fig. 11
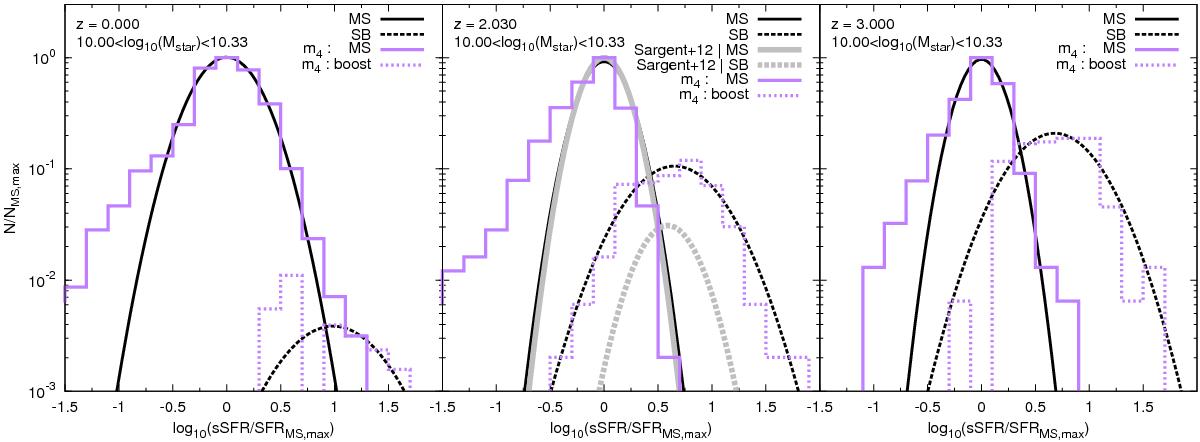
Specific star formation rate distributions derived from model m4, for galaxies with a stellar mass in the range: 10 < log 10(M⋆) < 10.33. The purple solid histogram shows the distribution of galaxies in the steady state mode (SFR ∝ accretion rate). Such a distribution contains main sequence (MS) and quiescent galaxies (sSFR/SFRMS< 0.1 in our study). The purple dashed-line histogram shows the distribution of the sSFR for galaxies with post-merger star-formation activity (PMSB) (Eq. (6) and following ![]() ). At z = 2 we compare our results with Sargent et al. (2012) measurements in which the quiescent population have been removed (grey solid line). For a better comparison with these observational measurements, we add a log-normal distribution as a black solid line adjusted only on our MS galaxy population. We have removed all galaxies with sSFR/SFRMS< 0.1. We see that model m4 is in very good agreement with the MS distribution but over-predicts the number of galaxy in the post-merger starburst mode (0.4 dex).
). At z = 2 we compare our results with Sargent et al. (2012) measurements in which the quiescent population have been removed (grey solid line). For a better comparison with these observational measurements, we add a log-normal distribution as a black solid line adjusted only on our MS galaxy population. We have removed all galaxies with sSFR/SFRMS< 0.1. We see that model m4 is in very good agreement with the MS distribution but over-predicts the number of galaxy in the post-merger starburst mode (0.4 dex).
Current usage metrics show cumulative count of Article Views (full-text article views including HTML views, PDF and ePub downloads, according to the available data) and Abstracts Views on Vision4Press platform.
Data correspond to usage on the plateform after 2015. The current usage metrics is available 48-96 hours after online publication and is updated daily on week days.
Initial download of the metrics may take a while.