| Issue |
A&A
Volume 574, February 2015
|
|
|---|---|---|
| Article Number | L8 | |
| Number of page(s) | 5 | |
| Section | Letters | |
| DOI | https://doi.org/10.1051/0004-6361/201425435 | |
| Published online | 03 February 2015 | |
The extended ROSAT-ESO Flux-Limited X-ray Galaxy Cluster Survey (REFLEX II)
VI. Effect of massive neutrinos on the cosmological constraints from clusters
Max-Planck-Institut für extraterrestrische Physik,
85748
Garching,
Germany
e-mail:
This email address is being protected from spambots. You need JavaScript enabled to view it.
Received: 29 November 2014
Accepted: 16 January 2015
Abstract
Clusters of galaxies are important probes for the large-scale structure that allow us to test cosmological models. With the REFLEX II galaxy cluster survey we previously derived tight constraints on the cosmological parameters for the matter density, Ωm, and the amplitude parameter of the matter density fluctuations, σ8. Whereas in these previous studies no effect of massive neutrinos was taken into account, we explore these effects in the present publication. We derive cosmological constraints for the sum of the neutrino masses of the conventional three neutrino families in the range Mν = ∑ imνi = 0 to 0.6 eV. The influence on the constraints of Ωm and σ8 for the expected mass range is weak. Interesting constraints on the neutrino properties can be derived by comparing the cluster data with those from the Planck cosmic microwave background observations. The current tension between the Planck results and clusters can formally be resolved with neutrino masses of about Mν = 0.45(±0.28,1σ) eV. While we caution not to consider this a firm measurement because it might also be the result of unresolved systematics, it is interesting that other measurements of the local large-scale structure fluctuation amplitude, like that of cosmic lensing shear, yield similar results and additionally confirm the effect of massive neutrinos. Among the indicators for massive neutrinos, galaxy clusters and in particular our large and well-controlled cluster survey currently provide the best potential for constraints of the total neutrino mass.
Key words: galaxies: clusters: general / large-scale structure of Universe / cosmology: observations / dark matter / X-rays: galaxies: clusters
© ESO, 2015
1. Introduction
Clusters of galaxies form from weak density fluctuations in the early Universe on comoving scales of several Mpc in a well-defined way. They can thus be used to statistically assess the large-scale structure. By applying this as a diagnostics, one can constrain cosmological models that describe our Universe. We have been using galaxy clusters from our statistically complete survey of galaxy clusters, the REFLEX (ROSAT-ESO Flux-Limited X-ray) Cluster Survey (Böhringer et al. 2001, 2004, 2013) to obtain constraints on cosmological model parameters (Böhringer et al. 2014). We derived in particular tight constraints on the matter density parameter, Ωm, and on the amplitude parameter of the matter density fluctuations, σ8 from the X-ray luminosity function measured in the nearby Universe.
In these calculations we assumed that neutrinos, filling the Universe in large abundance, have zero mass. Modern experimental results from solar, atmospheric, and reactor neutrinos (e.g. Fogli et al. 2012; Forero et al. 2012; Lesgourgues et al. 2013) show neutrino oscillations that imply that neutrinos are not massless; they therefore have an effect on the large-scale structure of the Universe (e.g. Lesgourges & Pastor 2006, 2014). The process by which neutrinos influence the large-scale structure growth is a partial damping of the density fluctuation power spectrum on small and intermediate scales up to about k ≥ 0.02 h Mpc-1 (≤160 h-1 Mpc) in comoving units (Lesgourges & Pastor 2006). Since the number of neutrinos in the present Universe is approximately fixed, the strength of the effect depends on the mass of the neutrinos. This mass is unevenly distributed between the three different neutrino species, but how exactly they share the mass is currently unknown. For our purposes the important parameter is the total mass of all neutrino families, Mν = ∑ imνi, and the distribution of the individual masses causes only higher order effects that are of no concern for our calculations. In addition, the effects of possible sterile neutrinos on the large-scale structure have been considered (e.g. Lesgourges & Pastor 2006, 2014). In this paper we focus on the effect of three conventional neutrinos.
There is an experimental lower limit on Mν with a value of about 0.06 eV (e.g. Fogli et al. 2012; Forero et al. 2012). Several upper limits have been derived from astronomical observations with Mν ≤ 0.93 eV from Planck alone (Planck Collaboration XVI 2014), Mν ≤ 0.9 eV from the SDSS power spectrum alone (Viel et al. 2010), a value of Mν = 0.36 ± 0.14 (1σ) eV from the SDSS III power spectrum combined with WMAP (Beutler et al. 2014), Mν ≤ 0.34 eV from SDSS III combined with cosmic microwave background (CMB) and supernova data (Zhao et al. 2013), Mν ≤ 0.18 eV from the matter power spectrum of the WiggleZ Dark Energy Survey combined with data from Planck and other BAO observations (Riemer-Sørensen 2014), and Mν ≤ 0.33 eV from a combination of the cluster mass function, CMB, supernova, and BAO data (Mantz et al. 2010). One of the tightest constraints comes from the large-scale structure analysis of the Lyα forest together with galaxy clustering, CMB, and supernova observations with Mν ≤ 0.17 eV (Seljak et al. 2006). In a recent paper, Costanzi et al. (2014) obtained constraints on a non-zero neutrino mass of  eV using WMAP9 (Planck) CMB as well as BAO, large-scale structure lensing shear and cluster data. Hamann & Hasenkamp (2013) and Battye & Moss (2014) also concluded on a positive signal for neutrino mass from CMB and lensing shear or cluster data.
Therefore massive neutrinos should be included in the modelling of the X-ray luminosity function to comply with the most recent results, which imply that neutrinos have mass. With a given neutrino number density we can calculate the contribution of neutrinos to the matter density in terms of the critical density and we find (e.g. Lesgourges & Pastor 2014)  (1)The aim of this paper is to explore how the constraints of cosmological parameters based on the REFLEX II survey data change by including massive neutrinos. While the effect of massive neutrinos on the cluster mass function and on the derived cosmological constraints has been explored before (e.g. Marulli et al. 2011; Costanzi et al. 2013; Burenin 2013), the application of the REFLEX II cluster sample adds a new dimension to the discussion for us. The REFLEX II galaxy cluster sample currently provides the most precise description of the shape of the X-ray luminosity function. The better the shape of the function is constrained, the better the degeneracy of the constraints on the parameters, Ωm, σ8, and Mν can be broken. It is a main goal of this paper to explore what this implies for our data. In addition, we also wish to study the possible implications on the neutrino mass that can be gained by a comparison of the cosmological constraints derived from our cluster sample with the results from the Planck observations of the CMB.
The paper is structured as follows: in Sect. 2 we describe the REFLEX II galaxy cluster sample and in Sect. 3 the cosmological modelling of these data. In Sect. 4 we then discuss the effects of massive neutrinos on the X-ray luminosity function, and in Sect. 5 we compare the cosmological constraints from clusters including massive neutrinos with those from the Planck CMB observations and draw our conclusions. Section 6 provides a summary. To determine all parameters that depend on distance, we use a flat Λ cold dark matter (CDM) cosmology with a matter density parameter Ωm as required by the model. Literature values quoted above have a scaling by h = H0/100 km s-1 Mpc-1, whereas the following results are scaled with h70 = h/0.7, if not stated otherwise. For the comparison with Planck we use a flat cosmology with Ωm = 0.315 and h = 0.673.
2. REFLEX II galaxy cluster survey
The REFLEX II galaxy cluster survey is based on the X-ray detection of galaxy clusters in the ROSAT All-Sky Survey (Trümper 1993; Voges et al. 1999). The region of the survey is the southern sky below equatorial latitude +2.5° and at Galactic latitude | bII | ≥ 20°. The regions of the Magellanic Clouds have been excised. The survey region selection, the source detection, the galaxy cluster sample definition and compilation, and the construction of the survey selection function as well as tests of the completeness of the survey are described in Böhringer et al. (2013). In summary, the survey area is ~4.24 ster. The nominal flux limit down to which galaxy clusters have been identified in the ROSAT All-Sky Survey in this region is 1.8 × 10⁻¹² erg s-1 cm-2 in the 0.1–2.4 keV energy band, yielding a catalogue of 911 clusters. To assess the large-scale structure in this paper, we applied an additional cut on the minimum number of detected source photons of 20 counts. This has the effect that the nominal flux cut quoted above is only reached in about 80% of the survey. In regions with lower exposure and higher interstellar absorption, the flux limit is accordingly higher (see Fig. 11 in Böhringer et al. 2013). This effect is modelled and taken into account in the survey selection function.
The flux limit imposed on the survey is for a nominal flux that has been calculated from the detected photon count rate for a cluster X-ray spectrum characterized by a temperature of 5 keV, a metallicity of 0.3 solar, a redshift of zero, and an interstellar absorption column density given by the 21 cm sky survey described by Dickey & Lockmann (1990). The result of this conversion of count rate to flux is an appropriate flux estimate before any redshift information and is analogous to an observed object magnitude corrected for Galactic extinction in the optical.
After the redshifts were measured, a new flux was calculated taking the redshifted spectrum and an estimate for the spectral temperature into account. The temperature was estimated by means of the X-ray luminosity – temperature relation from Pratt et al. (2009) determined from the REXCESS cluster sample. This is a sample of clusters drawn from REFLEX I for deeper follow-up observations with XMM-Newton, which is representative of the entire flux-limited survey (Böhringer et al. 2007). The luminosity was determined first from the observed flux by means of the luminosity distance for a given redshift. Using the X-ray luminosity mass relation given in Pratt et al. (2009), we then used the mass estimate to determine a fiducial radius of the cluster, which is taken to be r5001. We applied a beta model for the cluster surface brightness distribution to correct for the possibly missing flux in the region between the detection aperture of the source photons and the radius r500. The procedure to determine the flux, the luminosity, the temperature estimate, and r500 was performed iteratively and is described in detail in Böhringer et al. (2013). In this paper we deduced a mean flux uncertainty for the REFLEX II clusters of 20.6%, which is mostly due to the Poisson statistics of the source counts, but also contains some systematic errors.
The X-ray source detection and selection was based on the official ROSAT All-Sky Survey source catalogue by Voges et al. (1999). We used the publicly available final source catalogue2 as well as a preliminary source list that was created while producing the public catalogue. To improve the quality of the source parameters for the mostly extended cluster sources, we reanalysed all the X-ray sources with the growth curve analysis method (Böhringer et al. 2000). The flux cut was imposed on the reanalysed data set. The process of the source identification is described in detail in Böhringer et al. (2013).
3. Cosmological modelling of the REFLEX survey
Cosmological constraints were obtained by comparing cosmological model predictions for the galaxy cluster X-ray luminosity function with the observations from the REFLEX II project. The comparison was performed by means of a likelihood method. The details of this procedure are described in Böhringer et al. (2014), and we here provide only a brief outline. In a first step, the power spectrum of the matter density fluctuations for the present epoch is calculated with the program CAMB (Lewis et al. 2000)3. This is different to the previous calculations in Böhringer et al. (2014), where we used the program for the transfer function by Eisenstein & Hu (1998). By changing the calculations from the latter program to CAMB, we did not note any differences larger than one percent. Based on this power spectrum, we calculated the cluster mass function with the formulas given by Tinker et al. (2008). To derive the predicted X-ray luminosity function from the theoretically calculated cluster mass function, we used empirical scaling relations of X-ray luminosity and mass in accordance with the observations of Reiprich & Böhringer (2002), Pratt et al. (2009), and Vikhlinin et al. (2009), within their confidence limits. In the marginalisations of the constraints we allowed for a 7% uncertainty in the slope of the scaling relation and an uncertainty of 14% in its normalisation (equivalent to the mass calibration) as 1σ constraints of these parameters. For more details on the marginalisation see Böhringer et al. (2014). In the final likelihood fit we do not compare the luminosity functions directly, but the comparison is made between the predicted and observed X-ray luminosity distribution. To theoretically predict the X-ray luminosity distribution, the X-ray luminosity function has to be folded with the survey selection function, which is also described in detail in our previous paper.
Recent literature for example by Costanzi et al. (2014) suggested that the galaxy cluster mass function should be modelled in a particular way in the presence of massive neutrinos. The suggested modification consists of only using the matter density without neutrinos, ρm − ρν, in the relation of mass and filter radius to calculate the amplitude variance, σ(M)2, of the density fluctuations. We tested including this modification in our calculations and found that the results never changed by more than one percent. Since this is an order of magnitude smaller than the systematic uncertainties, we did not include the modification at this stage.
4. Effect of neutrinos on the cluster X-ray luminosity function
Before we describe the derived cosmological constraints, we explore the effect of neutrinos on the cluster abundance and the X-ray luminosity function of clusters. Neutrinos damp out large-scale structure during the evolution of the Universe inside the horizon scale as long as they are relativistic. Thus the greatest length scale for which we expect damping effects is approximately the horizon scale at the epoch when the neutrinos become non-relativistic. They can only damp a fraction of the amplitude that corresponds to their fraction of the total matter density.
If we fix the normalisation of the power spectrum at the epoch of recombination with the parameter, AS, the curvature power spectrum normalisation at a scale of k0 = 0.05 Mpc-1, as done for the Planck power spectrum, we see that the present epoch power spectrum is depressed at small scales below a wave vector of about 0.014 h70 Mpc-1 and the depression is stronger the larger Mν. The regime that is relevant for cluster formation is in the depression region. This is also the region in which the parameter σ8 is determined. Therefore we expect that the present-day value for σ8 will change with changing neutrino masses for a fixed AS normalisation. The ratio between these two parameters also depends on the matter density, Ωm, since the maximum of the power spectrum shifts with this parameter.
 |
Fig. 1 Constraints on the cosmological parameters Ωm and σ8 from a model fit to the observed REFLEX II X-ray luminosity distribution. The curves give 1 and 2σ constraints for models with Mν = 0, Mν = 0.4, and Mν = 0.6 eV for the set of contours from upper left to lower right (black, red, blue), respectively. |
The parameter σ8 was originally designed to describe the power spectrum amplitude at cluster scale. Thus to first order, ignoring subtle changes in the shape of the renormalised power spectrum, the value of σ8 fixes the cluster abundance. Therefore looking for the best-fitting σ8 for a given cluster abundance means in the modelling that power spectra for different neutrino masses will be rescaled such that they all give a very similar value of σ8. This is reflected in the constraints we obtain for the parameter combination of Ωm and σ8 adopting different values of Mν , as shown in Fig. 1. The subtle changes in the shape of the power spectrum cause small moves in the Ωm and σ8 parameter plane, but the changes are much smaller than the changes of σ8 with neutrino mass for fixed AS. While the shift in σ8 from Mν = 0 to Mν = 0.6 eV in Fig. 1 is Δσ8 = 0.04, it is about Δσ8 = 0.14 for fixed AS. For the results in Fig. 1 we have considered extreme cases. If the possible range of total neutrino masses is instead about 0.06 to 0.2 eV, we expect differences in the marginalisation results smaller than the present marginalisation uncertainties, if we use the σ8-normalisation of the power spectrum.
There is also hardly any distinction in the goodness of fit between the fits for different Mν. The likelihood changes by less than ΔL = 1, which is well within the one-sigma errors. Taking the cluster results alone therefore does not yield a clear preference for a neutrino mass in the mass range shown. A discrimination can be obtained by comparing this with the observations of the CMB, which will be discussed in the next section.
5. Comparison with the Planck CMB results
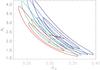 |
Fig. 2 Constraints on As and σ8 from the REFLEX II X-ray luminosity function for values of Mν = 0, 0.17, 0.4, and 0.6 eV for the contours from bottom to top, respectively. The contours give the 1 and 2σ confidence intervals. We also show the constraints derived from the Planck CMB observations (data point with 1σ error bars). |
To compare the present constraints with the Planck results, we chose a power spectrum normalisation that is applicable in the same way to both surveys. For this reason, we used the parameter, AS, the normalisation of the dimensionless curvature power spectrum, to normalise the power spectrum for the cluster abundance calculation, since this parameter is also used to normalise the power spectrum for the Planck data analysis (Planck Collaboration XVI 2014). With this parameter we calculated the matter power spectrum for the present epoch, folded it through the structure formation modelling and fitted it to the observed REFLEX X-ray luminosity function. In this way, we derived constraints on cosmological parameters in the Ωm − AS plane as displayed in Fig. 2. The plot shows the marginalisation results for four different total neutrino masses, Mν = 0,0.17,0.4, and 0.6 eV. As for the Ωm − σ8 constraints, the two parameters are somewhat degenerate. Similar to the data in Fig. 1, the likelihoods of the minima for the different contour sets feature a difference lower than ΔL ≤ 1. Thus within 1σ uncertainty limits, we cannot distinguish the goodness of fit between the different models. Taking the cluster data alone, all these neutrino masses are possible.
In Fig. 2 we compare the cluster constraints with the constraints from the analysis of the power spectrum of CMB anisotropies seen by Planck (Planck Collaboration XVI 2014). The Planck data point that represents the results for Planck+WP in Table 2 of Planck Collaboration XVI (2014) is shown with 1σ error bars. The Planck results have been derived for a cosmology with Mν = 0.06 eV, while the value for Mν was varied for the cluster constraints. We checked that the CMB power spectrum does not vary in any significant way with a variation of Mν in the considered range for fixed As. Therefore the cluster constraints for different values of Mν can be compared with one representation of the Planck data in this plot. The tilt of the cross of error bars for Planck follows the shape of the error ellipse. Its orientation is taken from the error ellipse shown in Fig. 11 of the publication by the Planck Collaboration XXIII (2014) and converted from the Ωm − σ8 to the Ωm − AS representation.
Formally, the two data sets can be reconciled for a total neutrino mass in the range Mν = 0.45(±0.28) eV including the combined 1σ uncertainties of both data sets (in a conservative way with a direct addition of the errors instead of a Gaussian addition)4. A similar conclusion was reached by the Planck Collaboration XXIII (2014): cluster and CMB data can be reconciled with a neutrino mass of about Mν = 0.58(±0.2). We caution, however, not to interpret this result too quickly as a constraint on the neutrino masses because it might in principle also be the result of systematic uncertainties and calibration problems. But the results definitely illustrate the power of combining the two cosmological probes to determine the neutrino masses.
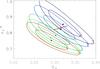 |
Fig. 3 Marginalised constraints for the rescaled parameter |
Most illustrations in the literature show constraints for the σ8 − Ωm diagram. This was also made for the cluster analysis of the clusters detected through the Sunyaev-Zeldovich effect with Planck in comparison with the Planck CMB results (Planck Collaboration XXIII 2014). Therefore we tried to find a way to translate the data shown in Fig. 2 into a plot of σ8 − Ωm constraints. This can be achieved by translating the Ωm − AS results into a σ8 − Ωm constraint in a representation that keeps the value of Mν fixed to 0.06 eV. This is analogous to an analysis of cosmological data as a function of the Hubble parameter, but choosing a representation in which the results are translated into a cosmology with a fixed value for H0. We achieved this by using for σ8 not the value we would measure at present for the given cosmology and Mν value, but instead we used a new parameter,  , the σ8 value that would be predicted on the bases of the As normalisation and the cosmological model used for the best fit of the Planck results with h = 0.673, Ωm = 0.315 and Mν = 0.06 eV. The new parameter is given by
 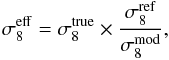 (2)where
  is the value from the Planck cosmology reference model for fixed As and
  the value for a similar model with the correct value for Mν and the same As. The resulting plot is shown in Fig. 3. The position of the Planck data point with respect to the cluster constraint contours is equivalent to the situation in Fig. 2, and the orientation of the error ellipse has been taken into account. The plot shows that the same relative location of the error contours and thus the conclusions on the constraints on Mν are the same as gained from Fig. 2.
6. Summary and conclusion
Based on the REFLEX II galaxy cluster survey and its well-defined X-ray luminosity function, we derived tight constraints on the cosmological parameters σ8 and Ωm and studied the influence of massive neutrinos on these results. Within the limits of the expected range of the total mass of the conventional three neutrino families of about Mν = 0.06−0.2 eV, we found only weak changes of σ8 and Ωm with neutrino mass. The changes are within the limits of the current uncertainties, and there is no preference for a certain total neutrino mass from the galaxy clusters alone.
The constraints become more interesting when the cluster data are combined with observations of the CMB anisotropies by Planck. For this comparison we performed the cosmological parameter constraints for the parameter combination As and Ωm. Without massive neutrinos there is a discrepancy between the results from the two data sets, as discussed previously (Planck Collaboration XXIII 2014; Böhringer 2014). When massive neutrinos are included, the discrepancy can formally be reconciled for a total neutrino mass of Mν = 0.45(±0.28) eV. It is interesting that a discrepancy between the CMB results and other measurements of the present-day large-scale structure amplitude have been found within the ΛCDM model without massive neutrinos. For example, Battye & Moss (2014) found constraints on the total neutrino mass of Mν = 0.320(±0.081) eV for the combination of Planck CMB data and lensing shear from the CFHTLens survey that agree well with our findings. Hamann & Hasenkamp (2013) found a similar tension in a massless neutrino cosmology for the combination of CMB and clusters as well as CMB and cosmic shear. In their analysis, they only investigated sterile neutrinos because these simultaneously decrease the tension in the results for the Hubble constant, and thus their result is not directly comparable with ours. Both Hamann & Hasenkamp (2013) and Costanzi et al. (2014) pointed out that the strongest driver for a positive neutrino mass comes from clusters. Since our results on the cluster abundance are among the most precise results, they will contribute to the strongest constraints for the total neutrino mass.
We here only considered classical neutrinos. The main driver to include sterile neutrinos in recent publications (e.g. Hamann & Hasenkamp 2013) is the difference on the Hubble parameter measured by Planck and locally with calibrated distance indicators such as the Cepheides. We have shown in a recent paper using our cluster data that there are indications that we live in a locally underdense region of the Universe in which one expects the Hubble parameter to be locally higher (Böhringer et al. 2015). It is worth noting that this can resolve some of the tension between the local and global measurement of H0. This also makes the results with massive non-sterile neutrinos more attractive.
The present marginalised constraints from the galaxy cluster data take the uncertainties in the scaling relations, the most serious bottle-neck preventing us from deriving tighter constraints, into account in a fairly conservative way (Böhringer et al. 2014). Much effort is currently made to better constrain the X-ray scaling relations of galaxy clusters with deeper observations of well-selected cluster samples with XMM-Newton and Chandra and to improve the cluster mass calibration with weak-lensing studies. For the Planck data intense calibration efforts are ongoing as well. We therefore expect a significant improvement of the understanding of the systematics in the near future, which will allow us to exploit the full potential of the observational data.
r500 is the radius where the average mass density inside reaches a value of 500 times the critical density of the Universe at the epoch of observation.
The RASS source catalogues can be found at http://www.xray.mpe.mpg.de/rosat/survey/rass-bsc/ for the bright sources and at http://www.xray.mpe.mpg.de/rosat/survey/rass-fsc/ for the faint sources.
CAMB is publicly available from http://www.camb.info/CAMBsubmit.html
The numerical values were obtained from the relative location of the error ellipses determined on a finer grid of Mν values, than those shown in Fig. 2. For this evaluation the exact orientation of the Planck error ellipse is crucial.
Acknowledgments
H.B. and G.C. acknowledge support from the DFG Transregio Program TR33 and the Munich Excellence Cluster “Structure and Evolution of the Universe”. G.C. acknowledges support by the DLR under grant No. 50 OR 1405.
References
- Battye, R. A., & Moss, A. 2014, Phys. Rev. Lett., 112, 051303 [NASA ADS] [CrossRef] [PubMed] [Google Scholar]
- Beutler, F., Saito, S., Brownstein, J. R., et al. 2014, MNRAS, 444, 3501 [NASA ADS] [CrossRef] [Google Scholar]
- Böhringer, H., Schuecker, P., Guzzo, L., et al. 2001, A&A, 369, 826 [NASA ADS] [CrossRef] [EDP Sciences] [Google Scholar]
- Böhringer, H., Schuecker, P., Guzzo, L., et al. 2004, A&A, 425, 367 [NASA ADS] [CrossRef] [EDP Sciences] [Google Scholar]
- Böhringer, H., Schuecker, P., Pratt, G. W., et al. 2007, A&A, 469, 363 [NASA ADS] [CrossRef] [EDP Sciences] [Google Scholar]
- Böhringer, H., Chon, G., Collins, C. A., et al. 2013, A&A, 555, A30 [NASA ADS] [CrossRef] [EDP Sciences] [Google Scholar]
- Böhringer, H., Chon, G., Collins, C. A., et al. 2014, A&A, 570, A31 [NASA ADS] [CrossRef] [EDP Sciences] [Google Scholar]
- Böhringer, H., Chon, G., Bristow, M., et al. 2015, A&A, 574, A26 [NASA ADS] [CrossRef] [EDP Sciences] [Google Scholar]
- Burenin, R. A. 2013, Astron. Lett., 39, 357 [Google Scholar]
- Costanzi, M., Villaescusa-Navarro, F., Viel, M., et al. 2013, JCAP, 12, 12 [Google Scholar]
- Costanzi, M., Sartoris, B., Viel, M., et al. 2014, JCAP, 14, 81 [Google Scholar]
- Eisenstein, D. J., & Hu, W. 1998, ApJ, 496, 605 [NASA ADS] [CrossRef] [Google Scholar]
- Fogli, G. L., Lisi, E., Marrone, A., et al. 2012, Phys. Rev. D, 86, 013012 [NASA ADS] [CrossRef] [Google Scholar]
- Forero, D. V., Tortola, M., & Valle, J. W. F. 2012, Phys. Rev. D, 86, 073012 [NASA ADS] [CrossRef] [Google Scholar]
- Hamann, J., & Hasenkamp, J. 2013, JCAP, 10, 44 [Google Scholar]
- Lesgourgues, J., & Pastor, S. 2006, Phys. Rep., 429, 307 [Google Scholar]
- Lesgourgues, J., Mangano, G., Miele, G., & Pastor, S. 2013, Neutrino Cosmology (Cambridge University Press) [Google Scholar]
- Lesgourgues, J., & Pastor, S. 2014, New J. Phys., 16, 065002 [NASA ADS] [CrossRef] [Google Scholar]
- Mantz, A., Allen, S. W., & Rapetti, D. 2010, MNRAS, 406, 1805 [NASA ADS] [Google Scholar]
- Marulli, F., Carbone, C, Viel, M., et al. 2011, MNRAS, 418, 346 [NASA ADS] [CrossRef] [Google Scholar]
- Planck Collaboration XVI. 2014, A&A, 571, A16 [NASA ADS] [CrossRef] [EDP Sciences] [Google Scholar]
- Planck Collaboration XXIII. 2014, A&A, 571, A23 [NASA ADS] [CrossRef] [EDP Sciences] [MathSciNet] [PubMed] [Google Scholar]
- Pratt, G. W., Croston, J. H., Arnaud, M., et al. 2009, A&A, 498, 361 [NASA ADS] [CrossRef] [EDP Sciences] [Google Scholar]
- Reiprich, T. H., & Böhringer, H. 2002, ApJ, 567, 716 [NASA ADS] [CrossRef] [Google Scholar]
- Riemer-Sørensen, S., Parkinson, D., & Davis, T. M. 2014, Phys. Rev. D, 89, 103505 [NASA ADS] [CrossRef] [Google Scholar]
- Seljak, U., Slosar, A., & McDonald, P. 2006, JCAP, 10, 14 [NASA ADS] [CrossRef] [Google Scholar]
- Tinker, J., Kravtsov, A. V., Klypin, A., et al. 2008, ApJ, 688, 709 [NASA ADS] [CrossRef] [Google Scholar]
- Trümper, J. 1993, Science, 260, 1769 [NASA ADS] [CrossRef] [PubMed] [Google Scholar]
- Viel, M., Haehnelt, M. G., & Springel, V. 2010, JCAP, 6, 15 [Google Scholar]
- Vikhlinin, A., Kravtsov, A. V., Burenin, R. A., et al. 2009, ApJ, 692, 1060 [NASA ADS] [CrossRef] [Google Scholar]
- Voges, W., Aschenbach, B., Boller, T., et al. 1999, A&A, 349, 389 [NASA ADS] [Google Scholar]
- Zhao, G.-B., Saito, S., Percival, W. J., et al. 2013, MNRAS, 436, 2038 [NASA ADS] [CrossRef] [Google Scholar]
All Figures
|
Fig. 1 Constraints on the cosmological parameters Ωm and σ8 from a model fit to the observed REFLEX II X-ray luminosity distribution. The curves give 1 and 2σ constraints for models with Mν = 0, Mν = 0.4, and Mν = 0.6 eV for the set of contours from upper left to lower right (black, red, blue), respectively. |
| In the text | |
|
Fig. 2 Constraints on As and σ8 from the REFLEX II X-ray luminosity function for values of Mν = 0, 0.17, 0.4, and 0.6 eV for the contours from bottom to top, respectively. The contours give the 1 and 2σ confidence intervals. We also show the constraints derived from the Planck CMB observations (data point with 1σ error bars). |
| In the text | |
|
Fig. 3 Marginalised constraints for the rescaled parameter |
| In the text | |
Current usage metrics show cumulative count of Article Views (full-text article views including HTML views, PDF and ePub downloads, according to the available data) and Abstracts Views on Vision4Press platform.
Data correspond to usage on the plateform after 2015. The current usage metrics is available 48-96 hours after online publication and is updated daily on week days.
Initial download of the metrics may take a while.