| Issue |
A&A
Volume 574, February 2015
|
|
|---|---|---|
| Article Number | L9 | |
| Number of page(s) | 4 | |
| Section | Letters | |
| DOI | https://doi.org/10.1051/0004-6361/201425324 | |
| Published online | 05 February 2015 | |
The hidden quasar nucleus of a WISE-selected, hyperluminous, dust-obscured galaxy at z ~ 2.3
1
Osservatorio Astronomico di Roma (INAF),
via Frascati 33, 00040
Monte Porzio Catone ( Roma),
Italy
e-mail:
This email address is being protected from spambots. You need JavaScript enabled to view it.
2
Dipartimento di Fisica e Astronomia, Università di
Bologna, Viale Berti Pichat
6/2, 40127
Bologna,
Italy
3
Osservatorio Astronomico di Bologna (INAF), via Ranzani
1, 40127
Bologna,
Italy
4
Dipartimento di Matematica e Fisica, Università degli Studi Roma
Tre, via della Vasca Navale
84, 00146
Roma,
Italy
5
Sterrenkundig Observatorium Universiteit Gent,
Krijgslaan 281, S9,
9000
Gent,
Belgium
6
Centro de Astrobiologia (CSIC-INTA), Dep. de Astrofísica, ESAC, PO
Box 78, 28691 Villanueva de la Cañada, Madrid, Spain
7
Institute de Radioastronomie Millimétrique,
300 rue de la Piscine, 38406 St. Martin
d’Hères, Grenoble,
France
8
Cavendish Laboratory, University of Cambridge,
19 J. J. Thomson Avenue,
Cambridge
CB3 0HE,
UK
Received: 12 November 2014
Accepted: 5 December 2014
Abstract
We present the first X-ray spectrum of a hot dust-obscured galaxy (DOG), namely W1835+4355 at z ~ 2.3. Hot DOGs represent a very rare population of hyperluminous (≥1047 erg s-1), dust-enshrouded objects at z ≥ 2 recently discovered in the WISE All Sky Survey. The 40 ks XMM-Newton spectrum reveals a continuum as flat (Γ ~ 0.8) as typically seen in heavily obscured AGN. This, along with the presence of strong Fe Kα emission, clearly suggests a reflection-dominated spectrum due to Compton-thick absorption. In this scenario, the observed luminosity of L2−10~ 2 × 1044 erg s-1 is a fraction (<10%) of the intrinsic one, which is estimated to be ≳ 5 × 1045 erg s-1 by using several proxies. The Herschel data allow us to constrain the SED up to the sub-mm band, providing a reliable estimate of the quasar contribution (~75%) to the IR luminosity as well as the amount of star formation (~2100 M⊙ yr-1). Our results thus provide additional pieces of evidence that associate Hot DOGs with an exceptionally dusty phase during which luminous quasars and massive galaxies co-evolve and a very efficient and powerful AGN-driven feedback mechanism is predicted by models.
Key words: galaxies: individual: WISE J183533.71+435549.1 / galaxies: active / galaxies: nuclei / submillimeter: galaxies / X-rays: galaxies
© ESO, 2015
1. Introduction
The detection and the study of the most luminous quasars (LBol≫ 1046 erg s-1) at 2 <z< 3, where their number density reaches a peak, is essential to understanding the major formation events over the supermassive black hole (SMBH) assembly history as well as to probing the co-evolution of host galaxies and their central SMBH at its extremes. For the luminous systems, models predict a merger-induced evolutionary sequence with an initial heavily dust reddened phase associated with strong and obscured SMBH growth and star formation (Silk & Rees 1998; Hopkins et al. 2008; Fabian 2012). There is growing evidence that the red phase coincides with the blow-out (i.e., AGN-driven feedback-dominated; Faucher-Giguere & Quataert 2012) phase, after which the quasar eventually evolves into a blue, optically bright source (Banerji et al. 2012; Glikman et al. 2012; Brusa et al. 2015).
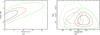 |
Fig. 1 a) Confidence contour plot for the photon index against the column density using an absorbed PL model. b) Confidence contour plot showing the normalization against energy of the Fe Kα emission line for the PN (solid lines) and MOS (dashed lines) spectrum. The contours are at 68%, 90%, and 99% confidence levels for two interesting parameters. |
Red luminous quasars are thus ideal test-beds for this AGN-driven feedback scenario. Spitzer observations allowed the discovery of a population of dust-obscured galaxies (DOGs hereafter) with extreme mid-IR/optical ratios (F24 μm/FR> 1000) and a flux density at 24 μm F24 μm ≳ 1 mJy at 1 <z< 3 (Dey et al. 2008). The AGN nature of DOGs is suggested by their mid-IR power-law spectrum and has been definitively confirmed via X-ray observations (Fiore et al. 2008; Lanzuisi et al. 2009, L09), which found a predominance of type-2 quasars (L2−10> 1044 erg s-1 and NH> 1022 cm-2) among them. The study of rare, very luminous DOGs is now taking advantage of the recent sensitive, wide-area surveys such as the all-sky WISE survey (Wright et al. 2010). In particular, by selecting “W1W2-dropout” objects, i.e., bright at 22 or 12 μm but very faint at 4.6 and 3.4 μm (WISE W4, W3, W2, and W1 bands, respectively), Eisenhardt et al. (2012) identified a population of ~1000 DOGs which stand out for being hyperluminous (LBol~1047 erg s-1) at z ~ 2–3. They were dubbed Hot DOGs because their spectral energy distributions (SED) typically exhibit a mid-IR/sub-mm emission ratio higher than other galaxy types, suggesting a large contribution from hot dust (Wu et al. 2012, 2014; Jones et al. 2014). Optical follow-up reveals narrow emission lines in most of their spectra. Hot DOGs show no clear-cut sign of gravitational lensing and, therefore, are truly hyperluminous. Since they likely represent a short-lived crucial phase in the evolution of the most powerful AGN in the universe, probing the nuclear properties of such recently-discovered extreme objects can clearly benefit our understanding of overall AGN-galaxy co-evolution.
This is our aim and here we report the first X-ray spectrum of a Hot DOG (namely WISE J183533.71+435549.1, hereafter W1835+4355, at z = 2.298, e.g., Wu et al. 2012) obtained by XMM-Newton. Throughout this Letter we assume H0 = 70 km s-1 Mpc-1, ΩΛ = 0.73, and ΩM = 0.27.
2. X-ray observation and data reduction
W1835+4355 was observed with XMM-Newton in revolution 2508 (18 August 2013) for about 42 ks (Obs. ID. 0720610101). The EPIC observations were performed with the PN and MOS cameras operating in Full-Window mode and with the Thin and Medium filter applied, respectively. The extraction of science products from the observation data files followed standard procedures using the XMM-Newton Science Analysis System SAS v13.5. X-ray events corresponding to patterns 0–4(0–12) for the PN(MOS) camera were selected. The event lists were filtered to ignore periods of high background flaring activity by selecting good time intervals with count rate <0.4(0.35) counts s-1 using single event PN(MOS) light curves at E> 10 keV. For the PN, the source photons were extracted with a circular region of 26 arsec radius, with the background being derived from a source-free 57 arcsec radius region on the same chip. MOS1 and MOS2 source(background) spectra were extracted using a circular region of radius 14(45) arcsec. The useful exposure times for spectroscopy was 35.7 and 41.2 ks for PN and MOS, respectively. Finally, we created a combined MOS spectrum and response matrix using addascaspec.
3. Results
W1835+4355 is well detected in both EPIC cameras at RA (J2000) = 18:35:33.76 and Dec (J2000) = +43:55:48.6, with a 0.3−10 keV net count rate of 3.4 ± 0.4, 1.4 ± 0.3, and 1.3 ± 0.2 × 10⁻³ counts s-1 in PN, MOS1 and MOS2, respectively. Spectral analysis was carried out using the modified Cash statistic (C-stat; Cash 1979) provided in XSPEC. The PN(MOS) spectrum was rebinned with a minimum of 10(7) counts bin-1 so that MOS and PN spectra contained a comparable number of spectral bins. In the following, errors correspond to the 90% (1.6σ) confidence level for one interesting parameter, i.e., ΔC = 2.71. A Galactic column density of NH = 5.2 × 1020 cm-2 (Kalberla et al. 2005) was applied to all spectral models. A power law (PL) model yielded statistically consistent spectral parameters with a slope Γ ~ 0.8 and a normalization ~1.3 × 10⁻³ photons/keV/cm2/s for separate fits to the PN and MOS spectra. The PN and MOS data were then fitted simultaneously in the 0.5–8 keV band. As a very flat spectral index is a typical indication of an absorbed continuum, we added an intrinsic absorption component to the model. The best-fit value of Γ remained, however, basically the same and we placed an upper limit of NH< 8 × 1022 cm-2 for the column density of the obscuring material (C-stat/d.o.f. = 42/30). Figure 1a shows the confidence contour plot of the column density of the cold absorber against the slope of the PL. If a canonical PL with Γ = 1.8 were present, this would imply a NH≳ 1023 cm-2 of the obscuring material. Interestingly, a positive excess in the fit residuals was present around 2 keV (i.e., ~6.4 keV rest frame), so a Gaussian emission component was added. This model provided a good description of the X-ray spectrum, with C-stat/d.o.f. = 22/29. The rest-frame energy of the line was 6.63 ± 0.09 keV, with a normalization of 1.0 ± 0.3 × 10⁻⁶ photons/keV/cm2/s. We measured a rest-frame equivalent width (EW) of the line  keV. The presence of such a strong emission feature is very interesting since reflection-dominated spectra of Compton-thick AGN are indeed characterized by a very flat photon index and prominent (i.e., EW ≳ 0.8 keV) iron K lines from neutral and ionized species (e.g., Matt et al. 2004; Nandra & Iwasawa 2007; Tilak et al. 2008). We therefore performed an additional investigation on this spectral feature as it was tempting to associate the X-ray emission of W1835+4355 with a completely buried quasar scenario. We first checked for the presence of the line in the PN and MOS spectrum separately. The significance of the line detection was at >99% confidence level for two parameters (i.e., energy and normalization) in both datasets, with the centroid being at 6.73 ± 0.19 keV (PN) and 6.55
 keV (MOS), i.e., consistent at 68% confidence level (Fig. 1b). We then inspected the properties of the Fe Kα line using unbinned (i.e., with a ΔE ~ 50 eV) PN and MOS spectra in the 1.6−2.5 keV band. In both cases, the underlying continuum was fitted by a PL with Γ = 0.9. The excess was confirmed in both datasets. In particular, it can be modeled by two narrow emission lines in the PN spectrum (which is the dataset with the best statistics, i.e., with a count PN/MOS ratio of ~1.3 in this energy interval). We fixed the energy of these lines at 6.4 and 6.67 keV to model the neutral Fe and FeXXV emission, respectively. As a further consistency check, we tied the redshift of the lines and left it free to vary. The best-fit value of z was found to be 2.28
 , i.e., consistent with the z = 2.298 reported by Wu et al. (2012). This suggested a likely blend of the two emission lines in the binned spectrum. The excess in the unbinned MOS spectrum can be fitted by a single line with a centroid at 6.54 ± 0.09 keV.
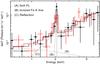 |
Fig. 2 The reflection-dominated model fitted to the unfolded PN (triangles) and MOS (circles) spectrum of W1835+4355. The individual spectral components (i.e., soft PL, ionized Fe emission line, and neutral reflection) are also shown as dotted lines. |
The combination of intense Fe Kα emission superimposed on a flat continuum in W1835+4355 led us to consider a pure reflection scenario for the X-ray emission from the AGN in this Hot DOG. To this end, we used the PEXMON model in XSPEC (Nandra et al. 2007) which includes both neutral Compton reflection and fluorescence neutral Fe emission lines. Given the above results, we also added a narrow Gaussian line to model the ionized Fe emission line. Assuming this spectral model, we obtained C-stat/d.o.f. = 24/29. The additional line was centered at 6.65 keV, while the best-fit value of photon index of the illuminating continuum was Γ ~ 2.4, i.e., steeper than the mean quasar index (i.e., 1.8–1.9; Piconcelli et al. 2005). The X-ray spectrum of heavily obscured AGN is characterized by the presence of a “soft excess”, which typically extends up to ~3 keV, and is due to line-dominated emission from large-scale photoionized gas and, in the case of star-forming galaxies, from hot, collisionally-ionized gas in starbursts. In CCD-like resolution and/or low quality spectra, a steep PL component (Γ ≈ 2.3−2.7, e.g., Turner et al. 1997; Comastri et al. 2010) is usually applied to account for this soft X-ray emission. Accordingly, we then added a PL with Γ fixed to 2.5 to the previous reflection model. This model yielded an excellent description to the data (see Fig. 2) without statistically significant unfitted features (C-stat/d.o.f. = 20/28), and a best-fit value
  for the intrinsic continuum slope. We measured a rest-frame
  eV for the ionized Fe line and a ratio between the normalization of the soft and intrinsic hard PL ~ 0.03, which is a typical value for heavily obscured AGN (Turner et al. 1997; Guainazzi et al. 2005).
This model gives a 2–10(0.5–2) keV flux of 2.11(0.28) × 10-14 erg cm-2 s-1, which corresponds to an observed luminosity L2−10 = 2.3 × 1044 erg s-1 (L0.5−2 = 2.9 × 1043 erg s-1).
4. SED of W1835+4355
To have a better understanding of W1835+4355 properties, we collected the available photometric information from literature and extracted flux densities from archival Herschel observations (see Table 1). To this end, we used HIPE to extract the 70, 160, 250, 350, and 500 μm source flux densities from the level2 fits files of W1835+4355 using circular regions of size 12, 12, 22, 30, and 42 arcsec, respectively; background was chosen from an annulus centered on the source (with an inner radius larger than the source extraction radius to avoid contamination by the source PSF tails), and proper aperture corrections were applied (as described in the PACS and SPIRE Data Reduction Guides). The source is detected from the observed mid-IR bands (where both Spitzer warm-mission data and AllWISE data are available) to the sub-mm band (SCUBA-2). This broadband coverage allows us to provide a good modeling of the SED in terms of an AGN plus a starburst component using the fitting code originally developed by Fritz et al. (2006), recently updated by Feltre et al. (2012), see Vignali et al. (2011) for a recent application of this code. For the hot AGN component, the code uses an extended grid of smooth torus models with a flared disc geometry (Fritz et al. 2006), which typically provides a good description of the AGN emission even in cases where only sparse photometric datapoints are available (see Feltre et al. 2012).
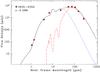 |
Fig. 3 Rest-frame SED of W1835+4355 (see Table 1 for the available photometry). The best-fitting SED (black continuous curve) derives from the contribution of an AGN (blue short-dashed line) and a star-forming component (red long-dashed curve); see text for details. |
Photometry of W1835+4355 from near-IR to sub-mm.
For the far-IR emission, an additional component due to colder diffuse light, heated by star formation processes, is included in the fitting procedure. The fit to this emission is carried out using templates of known starburst galaxies. As shown in Fig. 3, the AGN component (short-dashed line) is able to reproduce the emission at short wavelengths reasonably well, while in the far-IR, additional emission, linked to star formation activity and here parameterized with the Arp220 template, is needed. The adopted Arp220 template is semi-empirical, calculated with the GRASIL code (Silva et al. 1998). We also used several other templates of local starbursts to try to account for the far-IR emission of W1835+4355, but none of them produced acceptable results. Fitting the far-IR starburst-related emission with a modified blackbody model (fixing the emissivity index β = 2) provided an acceptable fit with Tdust = 39.9 ± 1.2 K and Mdust = 1.3 ± 0.2 × 10⁹M⊙, and a far-IR luminosity consistent with that inferred by our best-fitting model. The obscured AGN SED model alone can naturally account for the optical emission. This result can, in principle, be justified by the very high AGN luminosity; however, it can be partially due to the poor sampling of the rest-frame optical/near-IR SED. We can reproduce the data equally well using the same Arp220 template in the near-IR/optical band. In this case, a torus model with a slightly higher optical depth is required since part of the optical emission, originally ascribed to the AGN, is provided by stars. We therefore cannot exclude a stellar contribution to the optical emission, but it would not significantly change any of the derived quantities. From the best-fitting SED (Fig. 3) we can calculate both the LBol related to accretion processes and the star formation rate (SFR). The AGN bolometric luminosity is ≈4.8 × 1047 erg s-1, with a quasar contribution to the total L8−1000 μm of ~75%. To estimate the SFR, we converted the rest-frame 8–1000 μm luminosity due to star formation (L8−1000 μm≈ 4.6 × 1046 erg s-1) in the best-fitting SED using the Kennicutt et al. (1998) formula and obtained a SFR ≈ 2100M⊙ yr-1.
5. Discussion
The XMM-Newton observation presented here provides the first X-ray spectrum of a Hot DOG and highlights the potential offered by present-day X-ray telescopes to probe the nuclear environment of such hyperluminous high-z systems. As expected on the basis of the “W1W2-dropout” selection criterion, which preferentially picks up highly reddened objects, the X-ray continuum emission of W1835+4355 turns out to be very obscured. An absorbed PL model indeed gives a flat Γ = 0.8, indicative of NH≫ 1023 cm-2. The large EW Fe Kα line observed at ~6.6 keV (rest frame) can be thus interpreted as a signature of reflection-dominated spectrum due to a Compton-thick absorber blocking the direct continuum emission along the line of sight to the nucleus of W1835+4355. The presence of a typical soft excess PL component possibly suggests that the X-ray absorber allows some continuum emission to leak out. Previous 10–20 ks PN observations of Hot DOGs were unable to detect an X-ray source in two out of three cases, with the only faintly detected source (W1814+3412 at z ~ 2.4) showing an X-ray flux of 5 × 10-15 erg cm-2 s-1 (Stern et al. 2014), which further supports the presence of buried AGN in these galaxies. In this scenario, the observed hard X-ray luminosity of W1835+4355 (≈2 × 1044 erg s-1) must be considered only a fraction of the intrinsic one. The ratio observed/intrinsic L2−10 typically ranges from 0.05 to 0.012 for NH values in the range 1024 to 1025 cm-2 (Brightman & Nandra 2011; Singh et al. 2012). We are thus able to estimate a lower limit to the intrinsic L2−10 of ≈4.5 × 1045 erg s-1 for W1835+4355. Additional support for this range of L2−10 is given by the empirical mid-IR-X-ray luminosity relations. Specifically, we use the relation obtained by L09 for a large sample of DOGs with good X-ray spectral information. The L5.8 μm derived from the SED is ≈9 × 1046 erg s-1. Accordingly, in the L5.8 μm vs observed L2−10 plane shown in Fig. 6b of L09, the values for W1835+4355 suggest a NH close to 1024 cm-2. The observed L5.8 μm implies a L2−10≈ 4 × 1045 erg s-1, i.e., consistent with the X-ray-based estimate. Furthermore, the AGN LBol inferred in Sect. 4 translates into a L2−10≈ 5 × 1045 erg s-1 once a bolometric correction of ~100 is applied (Hopkins et al. 2007). We note, however, that such extreme luminosities are basically not sampled by these relations involving L2−10 and, therefore, these estimates should only be regarded as indicative.
Our results lend support to Hot DOGs as tracers of an exceptional, rapid, and dusty phase of quasar/host galaxy co-evolution. The X-ray spectrum and the SED of W1835+4355 indicate that it is indeed associated with the very luminous tip of both AGN and galaxy populations. The Herschel data allow us to constrain the emission from cold dust heated by star formation and infer that the host galaxy is rapidly star forming at a rate of thousands of M⊙ yr-1, i.e., similar to sub-mm galaxies (SMGs) at z ≥ 2 (Hayward 2013). Assuming a gas-to-dust ratio of ≈50 as found in SMGs (Kovács et al. 2006) and Mdust = 1.3 × 10⁹M⊙, the measured SFR can be sustained only for ~3 × 10⁷ yrs unless additional gas is provided.
Models and simulations predict that the combination of red phase and huge luminosity offers the opportunity of catching the AGN-driven feedback process at a maximum level of efficiency (Hopkins et al. 2008), and strong indications of feedback-related features, i.e., ~100 kpc extended Lyα blobs around some Hot DOGs, have indeed been reported (Bridge et al. 2013). Hot DOGs are thus ideal targets for millimeter interferometry to search for massive, galaxy-wide molecular outflows. Additional, well-designed X-ray observations of Hot DOGs will obtain crucial information about the poorly-studied nuclear environment of the most extreme AGN in the universe. Specifically, spectra above 10 keV can provide an invaluable, absorption-free view of their continuum source, responsible for their high luminosity.
Acknowledgments
We thank the anonymous referee for helpful comments. E.P. and A.B. acknowledge financial support from INAF under the contract PRIN-INAF-2012.
References
- Banerji, M., Fabian, A. C., & McMahon, R. G. 2014, MNRAS, 439, L51 [NASA ADS] [CrossRef] [Google Scholar]
- Bridge, C. R., Blain, A., Borys, C. J. K., et al. 2013, ApJ, 769, 91 [NASA ADS] [CrossRef] [Google Scholar]
- Brightman, M., & Nandra, K. 2011, MNRAS, 413, 1206 [CrossRef] [Google Scholar]
- Brusa, M., Bongiorno, A., Cresci, G., et al. 2015, MNRAS, 446, 239 [Google Scholar]
- Cash, W. 1979, ApJ, 228, 939 [NASA ADS] [CrossRef] [Google Scholar]
- Comastri, A., Iwasawa, K., Gilli, R., et al. 2010, ApJ, 717, 787 [NASA ADS] [CrossRef] [Google Scholar]
- Dey, A., Soifer, B. T., Desai, V., et al. 2008, ApJ, 677, 943 [NASA ADS] [CrossRef] [Google Scholar]
- Eisenhardt, P. R. M., Wu, J., Tsai, C.-W., et al. 2012, ApJ, 755, 173 [NASA ADS] [CrossRef] [EDP Sciences] [Google Scholar]
- Fabian, A. C. 2012, ARA&A, 50, 455 [NASA ADS] [CrossRef] [Google Scholar]
- Faucher-Giguère, C.-A., & Quataert, E. 2012, MNRAS, 425, 605 [NASA ADS] [CrossRef] [Google Scholar]
- Feltre, A., Hatziminaoglou, E., Fritz, J., & Franceschini, A. 2012, MNRAS, 426, 120 [NASA ADS] [CrossRef] [Google Scholar]
- Fiore, F., Grazian, A., Santini, P., et al. 2008, ApJ, 672, 94 [NASA ADS] [CrossRef] [Google Scholar]
- Fritz, J., Franceschini, A., & Hatziminaoglou, E. 2006, MNRAS, 366, 767 [Google Scholar]
- Glikman, E., Urrutia, T., Lacy, M., et al. 2012, ApJ, 757, 51 [NASA ADS] [CrossRef] [Google Scholar]
- Guainazzi, M., Matt, G., & Perola, G. C. 2005, A&A, 444, 119 [NASA ADS] [CrossRef] [EDP Sciences] [Google Scholar]
- Hayward, C. C. 2013, MNRAS, 432, L85 [NASA ADS] [CrossRef] [Google Scholar]
- Hopkins, P. F., Richards, G. T., & Hernquist, L. 2007, ApJ, 654, 731 [NASA ADS] [CrossRef] [Google Scholar]
- Hopkins, P. F., Hernquist, L., Cox, T. J., & Kereš, D. 2008, ApJS, 175, 356 [NASA ADS] [CrossRef] [Google Scholar]
- Jones, S. F., Blain, A. W., Stern, D., et al. 2014, MNRAS, 443, 146 [NASA ADS] [CrossRef] [Google Scholar]
- Kalberla, P. M. W., Burton, W. B., Hartmann, D., et al. 2005, A&A, 440, 775 [NASA ADS] [CrossRef] [EDP Sciences] [Google Scholar]
- Kennicutt, R. C., Jr. 1998, ARA&A, 36, 189 [Google Scholar]
- Kovács, A., Chapman, S. C., Dowell, C. D., et al. 2006, ApJ, 650, 592 [NASA ADS] [CrossRef] [Google Scholar]
- Lanzuisi, G., Piconcelli, E., Fiore, F., et al. 2009, A&A, 498, 67 (L09) [NASA ADS] [CrossRef] [EDP Sciences] [Google Scholar]
- Matt, G., Bianchi, S., Guainazzi, M., & Molendi, S. 2004, A&A, 414, 155 [NASA ADS] [CrossRef] [EDP Sciences] [Google Scholar]
- Nandra, K., & Iwasawa, K. 2007, MNRAS, 382, L1 [NASA ADS] [CrossRef] [Google Scholar]
- Nandra, K., O’Neill, P. M., George, I. M., & Reeves, J. N. 2007, MNRAS, 382, 194 [NASA ADS] [CrossRef] [Google Scholar]
- Piconcelli, E., Jimenez-Bailón, E., Guainazzi, M., et al. 2005, A&A, 432, 15 [NASA ADS] [CrossRef] [EDP Sciences] [Google Scholar]
- Silk, J., & Rees, M. J. 1998, A&A, 331, L1 [NASA ADS] [Google Scholar]
- Silva, L., Granato, G. L., Bressan, A., & Danese, L. 1998, ApJ, 509, 103 [NASA ADS] [CrossRef] [Google Scholar]
- Singh, V., Risaliti, G., Braito, V., & Shastri, P. 2012, MNRAS, 419, 2089 [NASA ADS] [CrossRef] [Google Scholar]
- Stern, D., Lansbury, G. B., Assef, R. J., et al. 2014, ApJ, 794, 102 [NASA ADS] [CrossRef] [Google Scholar]
- Tilak, A., Greenhill, L. J., Done, C., & Madejski, G. 2008, ApJ, 678, 701 [NASA ADS] [CrossRef] [Google Scholar]
- Turner, T. J., George, I. M., Nandra, K., & Mushotzky, R. F. 1997, ApJS, 113, 23 [NASA ADS] [CrossRef] [Google Scholar]
- Vignali, C., Piconcelli, E., Lanzuisi, G., et al. 2011, MNRAS, 416, 2068 [NASA ADS] [CrossRef] [Google Scholar]
- Wright, E. L., Eisenhardt, P. R. M., Mainzer, A. K., et al. 2010, AJ, 140, 1868 [NASA ADS] [CrossRef] [Google Scholar]
- Wu, J., Tsai, C.-W., Sayers, J., et al. 2012, ApJ, 756, 96 [NASA ADS] [CrossRef] [Google Scholar]
- Wu, J., Bussmann, R. S., Tsai, C.-W., et al. 2014, ApJ, 793, 8 [NASA ADS] [CrossRef] [Google Scholar]
All Tables
All Figures
|
Fig. 1 a) Confidence contour plot for the photon index against the column density using an absorbed PL model. b) Confidence contour plot showing the normalization against energy of the Fe Kα emission line for the PN (solid lines) and MOS (dashed lines) spectrum. The contours are at 68%, 90%, and 99% confidence levels for two interesting parameters. |
| In the text | |
|
Fig. 2 The reflection-dominated model fitted to the unfolded PN (triangles) and MOS (circles) spectrum of W1835+4355. The individual spectral components (i.e., soft PL, ionized Fe emission line, and neutral reflection) are also shown as dotted lines. |
| In the text | |
|
Fig. 3 Rest-frame SED of W1835+4355 (see Table 1 for the available photometry). The best-fitting SED (black continuous curve) derives from the contribution of an AGN (blue short-dashed line) and a star-forming component (red long-dashed curve); see text for details. |
| In the text | |
Current usage metrics show cumulative count of Article Views (full-text article views including HTML views, PDF and ePub downloads, according to the available data) and Abstracts Views on Vision4Press platform.
Data correspond to usage on the plateform after 2015. The current usage metrics is available 48-96 hours after online publication and is updated daily on week days.
Initial download of the metrics may take a while.