Fig. 8
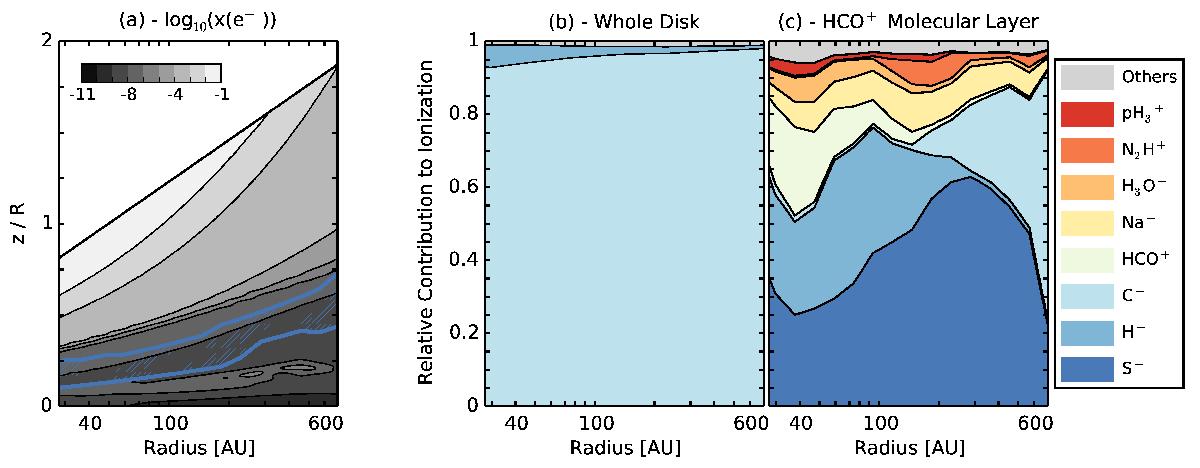
a) Ionization structure of the DM Tau disk model. The region bounded by blue lines is what we have defined as the HCO+ molecular layer. b) and c) relative contributions of charged species to the ionization level over the whole disk and the HCO+ molecular layer. As a disk average, panel b), it is clear the charge is dominated by C+ and H+, the grey region representing all other charged species. In the HCO+ molecular layer, panel c), defined as the region that contributes 90% of the total HCO+ column density, HCO+ supplies a majority of the charge with large contributions from H+, C+ and S+.
Current usage metrics show cumulative count of Article Views (full-text article views including HTML views, PDF and ePub downloads, according to the available data) and Abstracts Views on Vision4Press platform.
Data correspond to usage on the plateform after 2015. The current usage metrics is available 48-96 hours after online publication and is updated daily on week days.
Initial download of the metrics may take a while.