Fig. 7
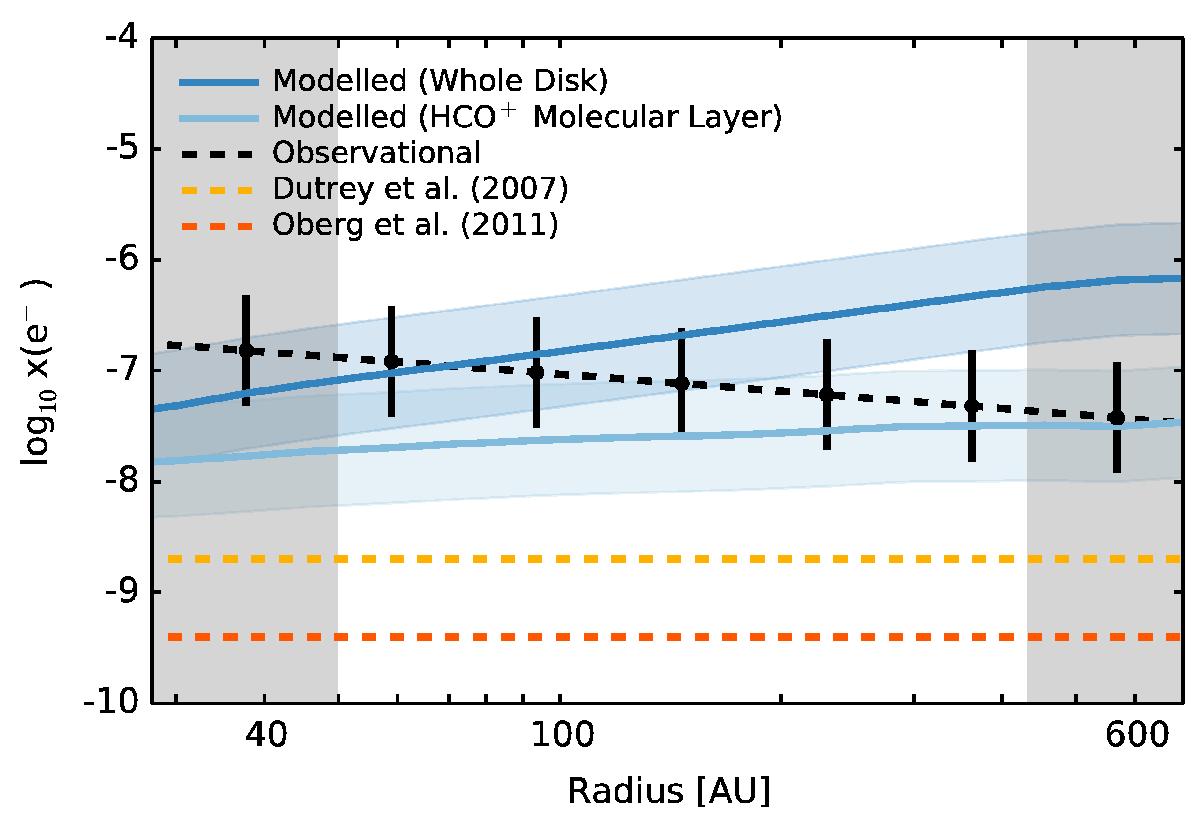
Constraints on the ionization fraction in DM Tau. Results from the steady state approximation are shown with: observational values, black dashed; modelled values from the entire disk, dark blue solid; modelled values from the HCO+ molecular layer, light blue solid; lower limit from Dutrey et al. (2007), light orange solid and lower limit from Öberg et al. (2011b), dark orange solid. All errors, dominated by the values from the chemical modelling, are a factor of 3.
Current usage metrics show cumulative count of Article Views (full-text article views including HTML views, PDF and ePub downloads, according to the available data) and Abstracts Views on Vision4Press platform.
Data correspond to usage on the plateform after 2015. The current usage metrics is available 48-96 hours after online publication and is updated daily on week days.
Initial download of the metrics may take a while.