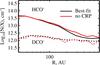
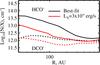
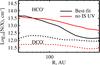
Fig. 6
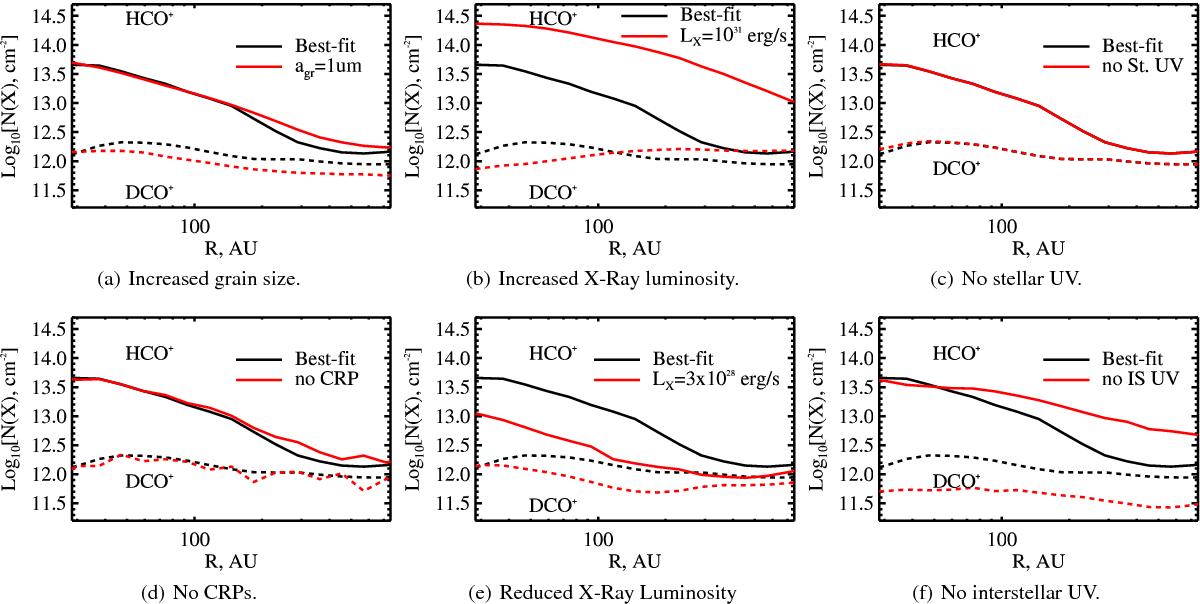
Computed molecular column densities for DCO+ (dashed line) and HCO+ (solid line). Black lines show the columns obtained with the best-fit model (see Sect. 3.3), red lines show the columns when the specified physical parameter is changed in the best fit model while the others are held constant. For reference, the canonical model has a single grain population of a = 0.1 μm, LX = 3 × 1029 erg s-1, χ∗(100 AU) = 410 and a CRP ionization rate of ζ = 1.3 × 10⁻¹⁷ s-1.
Current usage metrics show cumulative count of Article Views (full-text article views including HTML views, PDF and ePub downloads, according to the available data) and Abstracts Views on Vision4Press platform.
Data correspond to usage on the plateform after 2015. The current usage metrics is available 48-96 hours after online publication and is updated daily on week days.
Initial download of the metrics may take a while.