Fig. 3
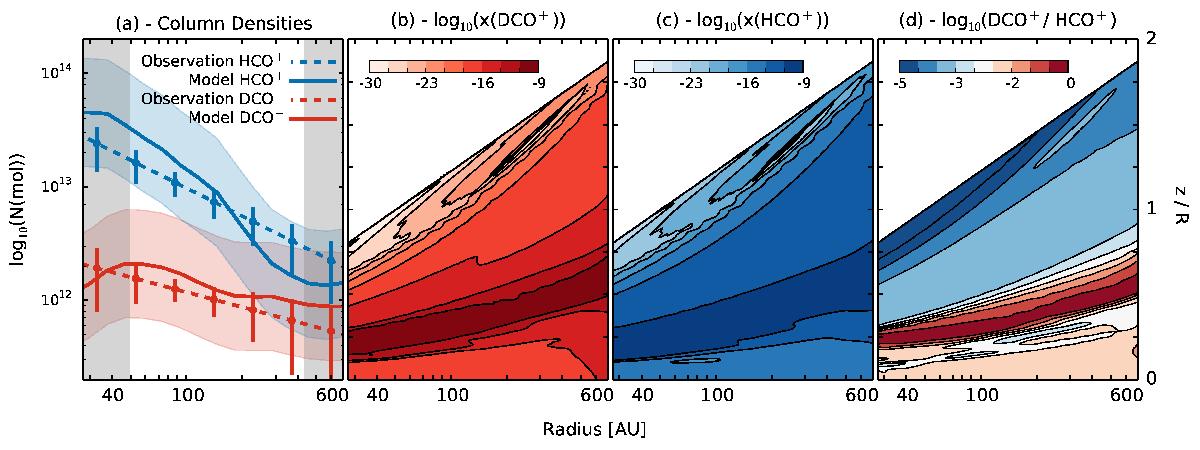
Deuterium fractionation in the disk. a) Comparisons of HCO+, blue, and DCO+, red, from observations, dashed with 3σ errors, and the best fit model, solid with associated error of a factor of 3. They grey vertical bars show where the observationally derived column densities are extrapolated beyond the inner and outer edges found in parameterisation. b) and c) show the relative abundances of DCO+ and HCO+ in the best fit disk chemical model respectively. d) shows the local DCO+/HCO+ ratio in the disk model.
Current usage metrics show cumulative count of Article Views (full-text article views including HTML views, PDF and ePub downloads, according to the available data) and Abstracts Views on Vision4Press platform.
Data correspond to usage on the plateform after 2015. The current usage metrics is available 48-96 hours after online publication and is updated daily on week days.
Initial download of the metrics may take a while.