| Issue |
A&A
Volume 574, February 2015
|
|
|---|---|---|
| Article Number | A101 | |
| Number of page(s) | 6 | |
| Section | Extragalactic astronomy | |
| DOI | https://doi.org/10.1051/0004-6361/201425050 | |
| Published online | 02 February 2015 | |
The BL-Lac gamma-ray blazar PKS 0447-439 as a probable member of a group of galaxies at z = 0.343
1
Instituto de Astronomía Teórica y Experimental (IATE,
CONICET-UNC), Laprida 854, X5000
BGR Córdoba
Argentina
e-mail:
This email address is being protected from spambots. You need JavaScript enabled to view it.
2
Observatorio Astronómico, Universidad Nacional de
Córdoba, Laprida 854,
X5000 BGR Córdoba,
Argentina
3
Instituto de Astronomía y Física del Espacio (IAFE,
CONICET-UBA), Av. Inte. Güiraldes 2620,
C1428 ZAA Buenos
Aires, Argentina
Received: 24 September 2014
Accepted: 25 November 2014
Abstract
Context. The BL-Lac blazar PKS 0447-439 is one of the brightest HE gamma-ray sources that were first detected by Fermi-LAT. It was also detected by H.E.S.S. at VHE gamma-rays, which allowed constraining the redshift of PKS 0447-439 by considering the attenuation caused by gamma-ray interactions with ambient photons in the extragalactic background light (EBL). This constraint agreed with color-magnitude and spectroscopic redshift constraints (0.179 <z< 0.56). Recently, however, a much higher redshift was proposed for this blazar (z> 1.2). This value was debated because if true, it would imply either that the relevant absorption processes of gamma-rays are not well understood or that the EBL is dramatically different from what is believed today. This high redshift was not confirmed by three independent new spectroscopic observations at high signal-to-noise ratios. The scenario is clear evidence of the difficulties in estimating the redshift of BL-Lac objects, whose optical spectra are typically featureless. Neither of the estimated redshifts for PKS 0447-439 are confirmed as yet.
Aims. Given that BL-Lac are typically hosted by elliptical galaxies, which in turn are associated with groups, we aim to find the host group of galaxies of PKS 0447-439. The ultimate goal is to estimate a redshift for this blazar.
Methods. Spectra of twenty-one objects in the field of view of PKS 0447-439 were obtained with the Gemini Multi-Object Spectrograph. Based on the redshifts and coordinates of these galaxies, we searched for groups of galaxies. Using a deep catalog of groups, we studied the probability of finding by chance a group of galaxies in the line of sight of PKS 0447-439.
Results. We identified a group of galaxies that was not previously cataloged at z = 0.343 with seven members, a virial radius of 0.42 Mpc, and a velocity dispersion of 622 km s-1. We found that the probability of the host galaxy of PKS 0447-439 to be a member of the new group is ≳97%. Therefore, we propose to adopt z = 0.343 ± 0.002 as the most likely redshift for PKS 0447-439.
Key words: BL Lacertae objects: individual: PKS 0447-439 / galaxies: distances and redshifts / galaxies: groups: general
© ESO, 2015
1. Introduction
Blazars are a subclass of active galactic nuclei (AGN) where the relativistic jet points close to the observer line of sight (e.g., Urry & Padovani 1995). They are one of the most powerful astrophysical sources and are characterized by rapid, strong, and irregular flux variability (e.g., Falomo et al. 2014). There are two populations of blazars, flat-spectrum radio quasars (FSRQ), and BL Lacertae (BL-Lac) objects. The latter are classified as low-, intermediate-, and high-peaked (LBL, IBL, and HBL) BL-Lacs, depending on the position of the lower energy bump in the spectral energy distribution (SED; Fossati et al. 1998). If the blazar evolution sequence is correct (Böttcher & Dermer 2002; Cavaliere & D’Elia 2002), FSRQs and BL-Lac objects would have an evolutionary link. FSRQs would be the earliest phase of an evolving sequence with a final long phase at the HBL stage, where the gas accretion rate (and jet density) from the host galaxy decreases. While the evolution of blazars is a matter of debate, there is some evidence supporting this transition from FSQR to BL-Lac (Giommi et al. 2012; Ajello et al. 2014).
The SED of BL-Lacs are dominated by strong nonthermal emission from the jet, which covers up all the characteristic spectral features of the host galaxy and usually prevents determining spectroscopic redshifts. Given this difficulty, other methods have been proposed for redshift determination, particularly important for the luminosity function at the gamma-ray domain where BL-Lacs are the most frequent extragalactic objects (e.g., Reimer & Böttcher 2013). Gamma-ray radiation in the range of very high-energy (VHE; E> 100 GeV) is strongly attenuated by the photon-photon interaction with the extragalactic background light (EBL) and for the more energetic gamma-rays, with the cosmic microwave background (CMB). As a consequence, all discovered extragalactic VHE sources (mostly BL-Lac blazars) are relatively close (z< 0.6, except perhaps for the recent not yet confirmed detection of the blazar S3 0218+357 at z = 0.944 – ATel #6349). At these redshifts, the attenuation due to photon-photon interaction for high-energy (HE; E> 100 MeV) gamma-rays is negligible. Then, for BL-Lac blazars gamma-ray astronomy provides an alternative method for estimating the redshift, which is to model the drop in the SED from HE to VHE caused by the photon-photon interaction (e.g., Dwek & Krennrich 2013). To do this, a distribution of the not very well-known EBL field has to be assumed, and both the spectrum at HE and VHE have to be measured. Thus, by extending the HE spectrum to higher energies, the drop HE-to-VHE is estimated and related to a true redshift value (Prandini et al. 2010). A caution for this procedure has been given by arguing that such an extension may not be the actual connection in the SED of blazars (Costamante 2012).
It has also been proposed that the absorption features in the far-ultraviolet spectra of BL-Lac objects can be used to estimate limits to the redshift of blazars (Danforth et al. 2010, 2013; Furniss et al. 2013). The far-ultraviolet spectra of blazars show a smooth continuum with intergalactic-medium absorption features (the Lyα forest) that can be used to set lower limits to the blazar redshift. The upper limit is set by statistically treating the non-detection of absorbers beyond a certain redshift.
The BL-Lac blazar PKS 0447-439 is one of the brightest HE sources that were first detected by Fermi-LAT (Abdo et al. 2009). It was also detected at VHE by H.E.S.S. with a soft derived spectrum (photon index 3.89) and no indication of break or curvature (Abramowski et al. 2013). Modeling the drop in the SED from HE to VHE, and assuming the EBL density of Franceschini et al. (2008), it was possible to derive an estimate of redshift for PKS 0447-439 of z ~ 0.2 (Prandini et al. 2012). This was based on H.E.S.S. preliminary results at VHE (Zech et al. 2011) and assuming average spectral properties of blazars. A more certain upper limit of z< 0.59 for the redshift of PKS 0447-439 was found by Abramowski et al. (2013) using a lower limit model of the EBL and assuming there are no upturns in the flux above the HE band; they have also found that a satisfactory description of the SED would not be feasible if the redshift upper limit is different from z ≲ 0.4. These results agree with the spectroscopic value z = 0.205 reported in 1998 using data taken with the CTIO 4 m telescope, in which the identification of weak Ca II absorption lines was claimed (Perlman et al. 1998). A lower limit of z> 0.176 for the redshift of PKS 0447-439 was also estimated from the optical V magnitude (Landt & Bignall 2008). On the other hand, the distribution of known redshifts for BL-Lac gamma-ray blazars has a peak approximately in the range z ≈ 0.1−0.3 with a tail to higher values (z ≲ 1.5) (Ackermann et al. 2011). Then, if the evolutionary link of the blazar sequence mentioned above is correct, the peak of this redshift distribution would mostly be populated by the blazar type HBL, as this is suggested to be the last long phase of the sequence. Provided PKS 0447-439 is classified as HBL (e.g., Abramowski et al. 2013), it would be reasonable to adopt a value for the redshift of PKS 0447-439 close to or within the peak.
While all these estimations showed a coherent picture for the distance of PKS 0447-439, a significantly higher lower limit of z> 1.246 for the redshift of this blazar was announced based on the identification of the Mg II λ2800 line doublet in absorption (Landt 2012). This estimate was considered very controversial as a high redshift like this for a VHE source would imply either that the relevant absorption processes of gamma-rays are not well understood or that the EBL is dramatically different from what is believed today. An alternative less exotic explanation for this high redshift was proposed by arguing that the distant TeV blazar emission could be compatible with secondary photons produced by energetic protons from the blazar jet propagating over almost rectilinear cosmological distances (Aharonian et al. 2013).
Immediately after the claim of Landt (2012) was announced, several spectroscopic observations were performed trying to confirm this high redshift (Pita et al. 2012; Fumagalli et al. 2012; Rovero et al. 2013). They all confirmed the absorption line at 6280 Å, which could result in a high-redshift value if identified as Mg II λ2796.82. However, they associated this line with a known telluric absorption line, invalidating the claim that this is a very distant blazar. No other spectral features were detected, therefore no spectroscopic redshift for PKS 0447-439 was established from any of these observations. It is worth to mention that the observations performed by Rovero et al. (2013) were made with the Gemini 8.1 m telescope at a significantly high signal-to-noise ratio (S/N ~ 200 at 4000 Å to ~500 at 6000 Å), the highest of all spectroscopic observations of PKS 0447-439. Despite this, Rovero et al. (2013) were not able to identify the Ca II absorption lines used by Perlman et al. (1998) to report a redshift of 0.205, which makes the latter an unconfirmed spectroscopic redshift. The fact that these Ca II lines were not seen by recent high-quality observations could be attributed to either a significant flux variability of AGNs, or to a poor line identification by Perlman et al. (1998), which is probably the case because they identified very weak Ca II lines on an otherwise featureless optical spectrum.
Since BL-Lacs are typically hosted by elliptical galaxies, it is expected that these objects are associated with groups or clusters of galaxies. Fried et al. (1993) found an excess in the galaxy density around BL-Lacs at low and intermediate redshifts. Other studies confirmed that BL-Lacs inhabit group environments (Wurtz et al. 1993, 1997; Falomo et al. 1993; Pesce et al. 1994, 1995; Smith et al. 1995). Motivated by this evidence, and considering the controversy on the redshift of PKS 0447-439, we have used spectroscopic data taken on this AGN and twenty-one other objects in the field to study its environment. Data taken on PKS 0447-439 were analyzed previously (Rovero et al. 2013). The aim of this work is to spectroscopically analyze a sample of 21 objects in the field of view of PKS 0447-439 to find their host group of galaxies. The structure of this paper is as follows: Sect. 2 describes the photometric and spectroscopic observations. In Sect. 3 we present the analysis and results, and in Sect. 4 we summarize our conclusions.
Where necessary, a cosmology with H0 = 70km s-1 Mpc-1, Ωm = 0.25, and ΩΛ = 0.75 is applied.
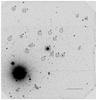 |
Fig. 1 GMOS g′-band image centered on PKS 0447-439. North is at top and east to the left. Observed objects are marked with circles and squares (group members) and labeled according to the slit number. The lower right line indicates 1 arcmin. |
2. Observations
Spectra for PKS 0447-439 and twenty-one other objects in the field were obtained with the Gemini Multi-Object Spectrograph (GMOS), program GS-2012B-Q25 (PI: A.C. Rovero). We centered the field on PKS 0447-439 covering a region of ~5 × 5 arcmin2. A multislit mask was created using a pre-image provided by Gemini. This image consisted of 1 × 30 s exposure in Sloan g′ (G0325) filter with a scale of 0.1456 arcsec pixel-1. Additional objects were chosen considering that concentration limits the total number of target fitting on the GMOS mask. The mask was designed by the slit-positioning algorithm (SPA) that determines which objects will be placed on the mask. Object selection by the SPA is based on object priority and position on the frame, ensuring that there is at least a two-pixel separation between object slits. About 30−40 slits can typically be placed on the mask, depending on the slit width. In our case, the final mask consisted of 22 slits. Figure 1 shows the objects selected for spectroscopy.
The pre-image was taken on 28 September 2012, while the spectroscopic data were acquired in queue mode on 21 November 2012 using the designed multislit mask. Slitlet dimensions were 1 arcsec by 4 arcsec. The grating in use was B600+ −G5323, which has a ruling density of 600 lines/mm. Three exposures of 900 s each were obtained with central wavelengths of 497 nm, 502 nm, and 507 nm to remove the gaps between the CCD chips. Science targets have thus a total exposure time of 0.75 h. The seeing was ~ 0.9 arcsec during the observations. Spectra typically cover the wavelength range 3900−5600 Å, although because the wavelength range depends on the slit position, some spectra start at ~3600 Å while others end at ~7000 ?. Flatfields, spectra of the standard star LTT7787, and the copper-argon CuAr lamp were also acquired to perform flux and wavelength calibrations. A binning of 2 × 2 was used, yielding a scale of 0.1456 arcsec per pixel and a theoretical dispersion of ~0.9 Å per pixel. Observed objects together with their coordinates and g magnitudes are listed in Table 1.
Spectroscopically observed objects.
2.1. Photometry at Bosque Alegre
Additionally, we procured images at B,V,R, and I from Johnson system using the 1.54 m telescope at Bosque Alegre, Córdoba. Images were taken on 14 September 2014 together with Landolt standards (Landolt 2007). The telescope has attached an Apogee Alta U9 CCD camera at the Newtonian focus, which gives an scale of 27.5 arcsec mm-1. The camera was binned 3 × 3, resulting in a 0.74 arcsec pixel. Exposure times were 150, 100, 50, and 80 s in the B,V,R, and I filters, respectively. The apparent magnitudes for PKS 0447-439 were then measured to be mB = 14.55, mV = 13.99, mR = 13.58, and mI = 14.35. Unfortunately, the other objects targeted for spectroscopy are fainter than the limiting magnitude of the CCD camera.
2.2. Data reduction
All science and calibration files were retrieved from the Gemini Science Archive hosted by the Canadian Astronomy Data Center. The data reduction described below was carried out with the Gemini IRAF package. Flatfields were derived with the task gsflat and the flatfield exposures. Spectra were reduced using gsreduce, which performs a standard data reduction (i.e., bias, overscan, and cosmic rays removal) and applies the flatfield derived with gsflat. GMOS-South detectors are read with three amplifiers that generate files with three distinct extensions. The task gmosaic was used to generate data files with a single extension. The sky level was removed interactively using the task gskysub, and the spectra were extracted using gsextract.
Flux calibration was performed using the spectra of the standard star LTT7787, acquired with an identical instrument configuration. Spectra of CuAr lamps were obtained immediately after science target observations and were used to achieve wavelength calibration using the task gswavelength. The sensitivity function of the instrument was derived using gsstandard and the reference file for LTT7787 provided by Gemini Observatory. Science spectra were flux calibrated with gscalibrate, which uses the sensitivity function derived by gsstandard.
Images were pre-processed through the standard Gemini pipeline that corrects bias, dark current, and flat field. Recent photometric zero points that yield standard magnitudes were taken from the Gemini website. The foreground galactic extinction around PKS 0447-439 is Ag = 0.045 mag (from the NASA Extragalactic Database).
Aperture photometry for the observed objects was made using DAOPHOT within IRAF. Total magnitudes were obtained through a series of circular diaphragms until the total flux converged. Previous to these calculations we made a careful background subtraction considering an area with an inner radius of 5′′ and outer radius of 10′′ centered on each object. In addition, neighbor objects were properly masked to avoid flux contamination.
Redshifts for the targeted objects around PKS 0447-439 were calculated using the FXCOR routine within IRAF. This task computes radial velocities by deriving the Fourier cross correlation between two spectra. In our case, the spectra obtained for the globular clusters and planetary nebulae in NGC 7793 were used as a template. All these spectra were taken with the same GMOS configuration during a previous Gemini run (GS-2011B-Q10, PI: C. Donzelli). These spectra have the necessary absorption or emission lines to correlate with those of the sample objects. In general terms, we have computed redshifts using four or more lines, usually Hγ, [OII] (3727 Å), Hβ, [OIII] (5007 Å), and the Ca II H+K absorption lines.
3. Results
3.1. Group of galaxies at z = 0.343
Figure 2 shows the redshift distribution of the 17 galaxies with measured redshift in the line of sight of PKS 0447-439. There is a group of galaxies at z ~ 0.34 consisting of seven galaxies. At this redshift, the field of view of GMOS is 1.45 × 1.45 Mpc. In Fig. 1, the group members are marked with squares. We computed the mean redshift (zmean), the virial radius (Rvir) and the velocity dispersion (σv) of the new group. The virial radius was computed following Nurmi et al. (2013)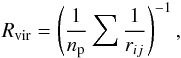 where rij is the projected distance between galaxies i and j for np pairs. The mean redshift and velocity dispersion were calculated using the Gapper estimator defined by Beers et al. (1990). We derived the following values: zmean = 0.343; Rvir = 0.42 Mpc and σv = 622 km s-1, which correspond to a high-mass group of galaxies. We were unnot able to take spectra of several other galaxies in the field of view of PKS 0447-439 as a result of overlapping slits. Some of these galaxies show magnitudes that are comparable with those of the group members. Therefore, the number of seven members should be taken as a lower limit. There is a pair of galaxies at z ~ 0.41.
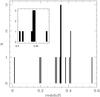 |
Fig. 2 Redshift distribution of the observed galaxies in the line of sight of PKS 0447-439. The inset shows a narrower redshift range around the new group of galaxies. |
3.2. PKS 0447-439 as a group member
As was previously discussed, BL-Lac objects are active nuclei hosted by massive elliptical galaxies. Since the former are usually found in groups or clusters of galaxies, it is natural to assume that PKS 0447-439 is a member of the group at z = 0.343. First of all, we tested the probability of finding by chance a group of galaxies with seven or more members around a random position in the sky. Knobel et al. (2009) identified hundreds of groups in the redshift range 0.1 ≲ z ≲ 1.0, 102 of them with 5 or more member galaxies, in a ~1.7 deg2 of the COSMOS field (Scoville et al. 2007). Using a Monte Carlo procedure, we made catalogs of random positions in the same field of view as that of the Knobel et al. (2009) catalog. Around each random position, we searched for coincidences with groups of galaxies in the Knobel et al. (2009) catalog that would have seven or more members. The search was performed within a projected distance equal to the virial radius of the new group (0.42 Mpc). Since the Knobel et al. (2009) catalog is deeper (z ≲ 1) than our sample (z ≲ 0.6), we restricted the analysis to the same redshift range. We found that the probability of finding by chance a group of galaxies in the redshift range 0 <z ≲ 0.6 around a random position is 9%. If no restriction is imposed on the redshift range of the group catalog, the resulting probability increases by only 3%.
If the host galaxy of PKS 0447-439 is not a member of the reported group, it probably is an isolated galaxy since no other structure is found in the line of sigh of the BL-Lac. As discussed, BL-Lac are typically associated with groups or clusters of galaxies. Consequently, the probability that the host galaxy of PKS 0447-439 is not a member of the reported group is the joint probability of having both an isolated host (Pih) and finding by chance a group of galaxies in the line of sight of PKS 0447-439 (Pcg = 9%). Because of the lack of deep spectroscopic surveys of galaxies in fields around blazars, there is no accurate estimate of Pih. Based on a photometric study, Wurtz et al. (1997) found that the clustering environments of BL-Lac objects are on average poor clusters. Although this method only relies on images and therefore is rather inefficient to detect groups of galaxies, two-thirds of the environment studies by Wurtz et al. (1997) show positive net counts of galaxies after background subtraction. Combining photometric and spectroscopic data, Pesce et al. (1995) found similar results. Based on this evidence, we consider that a conservative estimate of the probability to have a blazar in an isolated host is Pih ≲ 0.3. Since Pih and Pcg are the probabilities of two independent events, the joint probability of having both is Pih × Pcg ≲ 3%. In other words, the probability that the host galaxy of PKS 0447-439 is a member of the reported group is ≳97%.
Landt et al. (2002) suggested that BL-Lac spectra become featureless for jet-to-galaxy luminosity ratios ≳10. In the case of PKS 0447-439, where the spectrum was taken with a high signal-to-noise ratio, a jet-to-galaxy ratio ≳20−40 might be more appropriate (compare the spectrum in Fig. 1 of Rovero et al. 2013 with the simulated spectra in Fig. 1 of Landt et al. 2002). Assuming that the host galaxy is a bright elliptical, we can estimate the expected jet-to-galaxy ratio assuming that PKS 0447-439 has a redshift z = 0.343. For an absolute magnitude MR ~ −23 (a typical value for the host galaxy of BL-Lacs) we found a jet-to-galaxy ratio ≳30. This high value is consistent with the featureless spectrum of PKS 0447-439.
Assuming a z = 0.343 for PKS 0447-439 and the apparent magnitude mR = 13.58 obtained in Sect. 2.1, we estimated an absolute magnitude of MR = −27.65, which was computed as  where dL is the luminosity distance; AR is the galactic reddening; K(z) is the K-correction, and E(z) is the evolutionary correction. K(z) and E(z) were computed following Fan & Lin (2000). The derived value can be compared with those from other BL-Lacs. Kapanadze (2013) compiled a sample of X-ray selected BL-Lacs (XBL catalog); for 94 out of 312 objects they quoted both the host and the jet contributions to the total luminosity. Figure 3 shows the absolute R-band jet magnitude of BL-Lac objects in the XBL catalog. The vertical arrow corresponds to the absolute magnitude of PKS 0447-439. Note that this comparison neglects the host contribution. Clearly, PKS 0447-439 is among the brightest BL-Lacs, which is also consistent with the featureless observed spectra. If the blazar were at a much higher redshift, the jet luminosity of PKS 0447-439 would have an unprecedentedly high brightness. On the other hand, if the blazar were at a much lower redshift, host galaxy contribution should be observed. Based on this idea, Landt & Bignall (2008) estimated for PKS 0447-439 a lower limit of z> 0.176 (assuming a jet-to-galaxy ratio of ten).
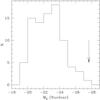 |
Fig. 3 Distribution of the absolute R-band jet magnitude of the BL-Lac objects in the XBL catalog. The vertical arrow shows the absolute magnitude of PKS 0447-439 at a redshift of 0.343. |
4. Discussion and conclusions
Using the Gemini Multi-Object Spectrograph, we obtained the spectra of twenty-one objects in the field of view of the blazar PKS 0447-439. At least 17 of these objects are galaxies in the redshift range 0.015 ≲ z ≲ 0.56. We identified a group of galaxies at z = 0.343 with seven members. The group has a virial radius of Rvir = 0.42 Mpc and a velocity dispersion σ = 622km s-1. We estimated a 9% probability of finding by chance a group like the one observed. If the host galaxy of PKS 0447-439 is not a member of the reported group, it probably is an isolated galaxy since no other structure is found in the line of sight of the BL Lac. We found that the joint probability of having both, an isolated host and finding by chance a group of galaxies in the line of sight of PKS 0447-439 is ≲3%. Therefore, the probability that the host galaxy of PKS 0447-439 is a member of the reported group is ≳97%. Considering these results, we propose to adopt z ~ 0.343 ± 0.002 as the most likely redshift for PKS 0447-439. The quoted uncertainty corresponds to the velocity dispersion of the parent group.
For a redshift of 0.343, we derived an absolute magnitude of MR = −27.65. Because the spectrum of PKS 0447-439 is featureless, we assume that the observed luminosity is mostly due to the jet contribution. Under this assumption, PKS 0447-439 is among the brightest BL-Lacs. We also estimated a lower limit for the jet-to-host ratio assuming that the host galaxy is a bright elliptical and found a jet-to-galaxy ratio ≳20−40. For this high ratio, a featureless spectrum is expected (Landt et al. 2002). Therefore, the observed spectrum of PKS 0447-439 is also consistent with the proposed redshift.
From the point of view of gamma-ray astronomy, the redshift proposed here agrees with other estimates in the literature. However, it has to be stressed that all these estimates used some level of assumption on one or more of the variables involved in the estimation, such as the EBL density and the intrinsic spectrum shape. On the other hand, redshift estimates from spectroscopic observations have failed to determine the value for PKS 0447-439, either because they found no features at all or because the lines used were very weak and the measurement was never confirmed by independent observations. Perhaps the spectroscopic procedure using spectra at far-ultraviolet (Danforth et al. 2010, 2013; Furniss et al. 2013) could be used to confirm the redshift of this blazar, for which HST/COS observations need to be performed. We here provided a totally independent estimate for the redshift of PKS 0447-439. The method applied in this work to estimate the redshift of PKS 0447-439 can be applied to other BL-Lacs with featureless spectra, for which deep spectroscopic observations would be necessary.
Acknowledgments
This work is based on observations obtained at the Gemini Observatory, which is operated by the Association of Universities for Research in Astronomy, Inc., under a cooperative agreement with the NSF on behalf of the Gemini partnership: the National Science Foundation (United States), the National Research Council (Canada), CONICYT (Chile), the Australian Research Council (Australia), Ministério da Ciência, Tecnologia e Inovação (Brazil) and Ministerio de Ciencia, Tecnología e Innovación Productiva (Argentina). This work has been partially supported with grants from Consejo Nacional de Investigaciones Científicas y Técnicas de la República Argentina (CONICET) and Secretaría de Ciencia y Tecnología de la Universidad de Córdoba. The authors H.M., C.D., and A.C.R. are members of “Carrera del Investigador Científico” of CONICET, Argentina, and A.P. is a postdoctoral fellow of CONICET, Argentina.
References
- Abdo, A. A., Ackermann, M., Ajello, M., et al. 2009, ApJ, 700, 597 [NASA ADS] [CrossRef] [Google Scholar]
- Abramowski, A., Acero, F., Akhperjanian, A. G., et al. 2013, A&A, 552, A118 [NASA ADS] [CrossRef] [EDP Sciences] [Google Scholar]
- Ackermann, M., Ajello, M., Allafort, A., et al. 2011, ApJ, 743, 171 [NASA ADS] [CrossRef] [Google Scholar]
- Aharonian, F., Essey, W., Kusenko, A., & Prosekin, A. 2013, Phys. Rev. D, 87 [Google Scholar]
- Ajello, M., Romani, R. W., Gasparrini, D., et al. 2014, ApJ, 780, 73 [NASA ADS] [CrossRef] [Google Scholar]
- Beers, T. C., Flynn, K., & Gebhardt, K. 1990, AJ, 100, 32 [NASA ADS] [CrossRef] [Google Scholar]
- Böttcher, M., & Dermer, C. D. 2002, ApJ, 564, 86 [NASA ADS] [CrossRef] [Google Scholar]
- Cavaliere, A., & D’Elia, V. 2002, ApJ, 571, 226 [NASA ADS] [CrossRef] [Google Scholar]
- Costamante, L. 2012, 2011 Fermi Symp. Proc. – eConf C110509 [arXiv:1208.0810] [Google Scholar]
- Danforth, C. W., Keeney, B. A., Stocke, J. T., Shull, J. M., & Yao, Y. 2010, ApJ, 720, 976 [NASA ADS] [CrossRef] [Google Scholar]
- Danforth, C. W., Nalewajko, K., France, K., & Keeney, B. A. 2013, ApJ, 764, 57 [NASA ADS] [CrossRef] [Google Scholar]
- Dwek, E., & Krennrich, F. 2013, Astropart. Phys., 43, 112 [NASA ADS] [CrossRef] [Google Scholar]
- Falomo, R., Pesce, J. E., & Treves, A. 1993, AJ, 105, 2031 [NASA ADS] [CrossRef] [Google Scholar]
- Falomo, R., Pian, E., & Treves, A. 2014, A&ARv, 22, 73 [NASA ADS] [CrossRef] [Google Scholar]
- Fan, J. H., & Lin, R. G. 2000, ApJ, 537, 101 [NASA ADS] [CrossRef] [Google Scholar]
- Fossati, G., Maraschi, L., Celotti, A., Comastri, A., & Ghisellini, G. 1998, MNRAS, 299, 433 [NASA ADS] [CrossRef] [Google Scholar]
- Franceschini, A., Rodighiero, G., & Vaccari, M. 2008, A&A, 487, 837 [NASA ADS] [CrossRef] [EDP Sciences] [Google Scholar]
- Fried, J. W., Stickel, M., & Kuehr, H. 1993, A&A, 268, 53 [NASA ADS] [Google Scholar]
- Fumagalli, M., Furniss, A., O’Meara, J. M., et al. 2012, A&A, 545, A68 [NASA ADS] [CrossRef] [EDP Sciences] [Google Scholar]
- Furniss, A., Fumagalli, M., Danforth, C., Williams, D. A., & Prochaska, J. X. 2013, ApJ, 766, 35 [NASA ADS] [CrossRef] [Google Scholar]
- Giommi, P., Padovani, P., Polenta, G., et al. 2012, MNRAS, 420, 2899 [NASA ADS] [CrossRef] [Google Scholar]
- Kapanadze, B. Z. 2013, AJ, 145, 31 [NASA ADS] [CrossRef] [Google Scholar]
- Knobel, C., Lilly, S. J., Iovino, A., et al. 2009, ApJ, 697, 1842 [NASA ADS] [CrossRef] [Google Scholar]
- Landolt, A. U. 2007, AJ, 133, 2502 [NASA ADS] [CrossRef] [Google Scholar]
- Landt, H. 2012, MNRAS, 423, L84 [NASA ADS] [Google Scholar]
- Landt, H., & Bignall, H. E. 2008, MNRAS, 391, 967 [NASA ADS] [CrossRef] [Google Scholar]
- Landt, H., Padovani, P., & Giommi, P. 2002, MNRAS, 336, 945 [NASA ADS] [CrossRef] [Google Scholar]
- Nurmi, P., Heinämäki, P., Sepp, T., et al. 2013, MNRAS, 436, 380 [NASA ADS] [CrossRef] [Google Scholar]
- Perlman, E. S., Padovani, P., Giommi, P., et al. 1998, AJ, 115, 1253 [NASA ADS] [CrossRef] [Google Scholar]
- Pesce, J. E., Falomo, R., & Treves, A. 1994, AJ, 107, 494 [NASA ADS] [CrossRef] [Google Scholar]
- Pesce, J. E., Falomo, R., & Treves, A. 1995, AJ, 110, 1554 [NASA ADS] [CrossRef] [Google Scholar]
- Pita, S., Boisson, C., Becherini, Y., et al. 2012, AIP Conf. Proc., 1505, 566 [NASA ADS] [CrossRef] [Google Scholar]
- Prandini, E., Bonnoli, G., Maraschi, L., Mariotti, M., & Tavecchio, F. 2010, MNRAS, 405, L76 [NASA ADS] [CrossRef] [Google Scholar]
- Prandini, E., Bonnoli, G., & Tavecchio, F. 2012, A&A, 543, A111 [NASA ADS] [CrossRef] [EDP Sciences] [Google Scholar]
- Reimer, A., & Böttcher, M. 2013, Astropart. Phys., 43, 103 [NASA ADS] [CrossRef] [Google Scholar]
- Rovero, A. C., Donzelli, C., Muriel, H., Cillis, A., & Pichel, A. 2013, 33rd ICRC, Rio de Janeiro, Brazil [arXiv:1307.6907] [Google Scholar]
- Scoville, N., Aussel, H., Brusa, M., et al. 2007, ApJS, 172, 1 [NASA ADS] [CrossRef] [Google Scholar]
- Smith, E. P., O’Dea, C. P., & Baum, S. A. 1995, ApJ, 441, 113 [NASA ADS] [CrossRef] [Google Scholar]
- Urry, M. C., & Padovani, P. 1995, PASP, 107, 803 [NASA ADS] [CrossRef] [Google Scholar]
- Wurtz, R., Ellingson, E., Stocke, J. T., & Yee, H. K. C. 1993, AJ, 106, 869 [NASA ADS] [CrossRef] [Google Scholar]
- Wurtz, R., Stocke, J. T., Ellingson, E., & Yee, H. K. C. 1997, ApJ, 480, 547 [NASA ADS] [CrossRef] [Google Scholar]
- Zech, A., Behera, B., Becherini, Y., et al. 2011, PoS(Texas 2010) 200 [Google Scholar]
All Tables
All Figures
|
Fig. 1 GMOS g′-band image centered on PKS 0447-439. North is at top and east to the left. Observed objects are marked with circles and squares (group members) and labeled according to the slit number. The lower right line indicates 1 arcmin. |
| In the text | |
|
Fig. 2 Redshift distribution of the observed galaxies in the line of sight of PKS 0447-439. The inset shows a narrower redshift range around the new group of galaxies. |
| In the text | |
|
Fig. 3 Distribution of the absolute R-band jet magnitude of the BL-Lac objects in the XBL catalog. The vertical arrow shows the absolute magnitude of PKS 0447-439 at a redshift of 0.343. |
| In the text | |
Current usage metrics show cumulative count of Article Views (full-text article views including HTML views, PDF and ePub downloads, according to the available data) and Abstracts Views on Vision4Press platform.
Data correspond to usage on the plateform after 2015. The current usage metrics is available 48-96 hours after online publication and is updated daily on week days.
Initial download of the metrics may take a while.