Free Access
Fig. 1
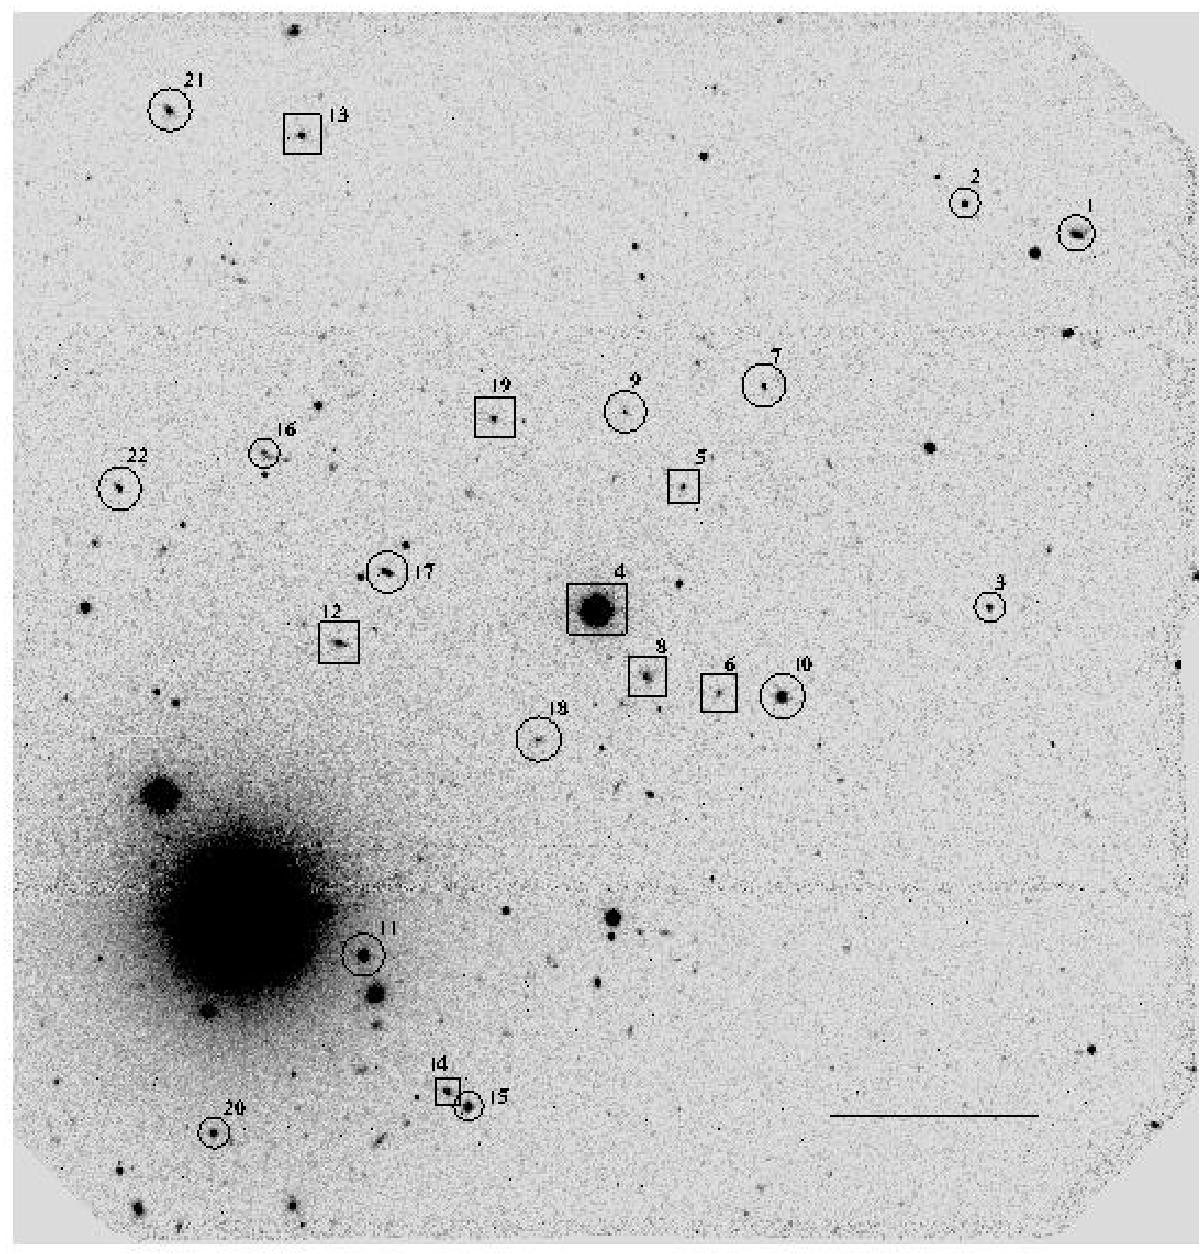
GMOS g′-band image centered on PKS 0447-439. North is at top and east to the left. Observed objects are marked with circles and squares (group members) and labeled according to the slit number. The lower right line indicates 1 arcmin.
Current usage metrics show cumulative count of Article Views (full-text article views including HTML views, PDF and ePub downloads, according to the available data) and Abstracts Views on Vision4Press platform.
Data correspond to usage on the plateform after 2015. The current usage metrics is available 48-96 hours after online publication and is updated daily on week days.
Initial download of the metrics may take a while.