Fig. 8
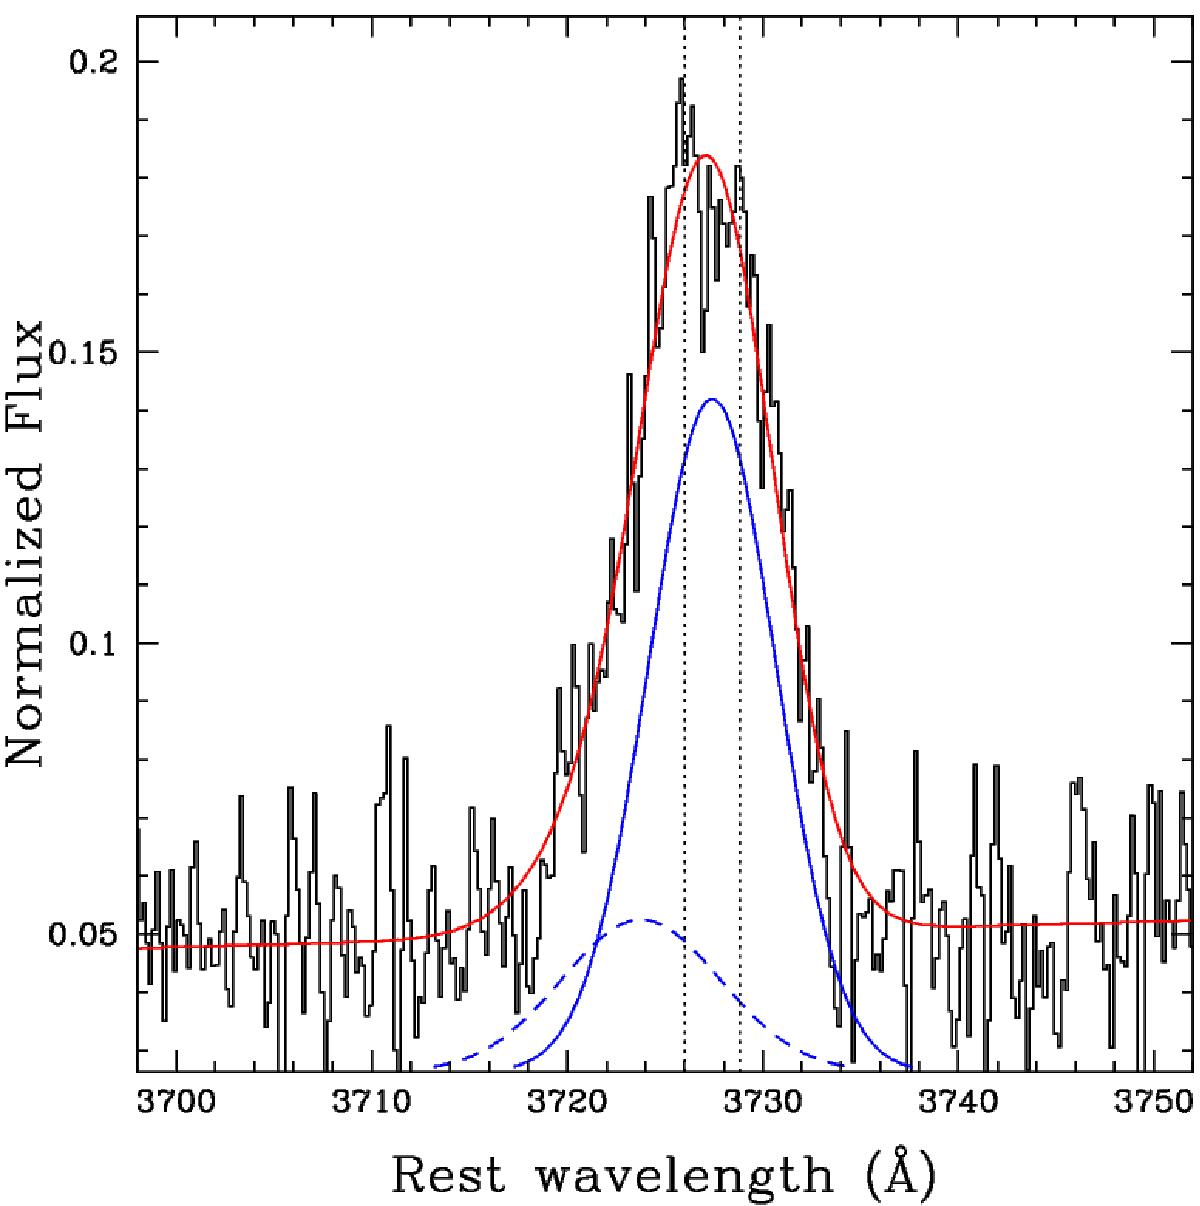
Keck/DEIMOS spectrum around the [OII]λλ3726,3729 region of XID2028. The spectrum is normalized so that the intensity of the strongest emission line (in the VIS+NIR wavelength range) of the nuclear aperture is unity. Superimposed on the spectrum are the best fit non-parametric analysis components (solid and dashed blue curves, with arbitrary normalization in order to ease the visualization). The red solid curves represent the sum of all components, including the power-law. Dotted lines mark the wavelengths of the [OII] emission lines.
Current usage metrics show cumulative count of Article Views (full-text article views including HTML views, PDF and ePub downloads, according to the available data) and Abstracts Views on Vision4Press platform.
Data correspond to usage on the plateform after 2015. The current usage metrics is available 48-96 hours after online publication and is updated daily on week days.
Initial download of the metrics may take a while.