Fig. 7
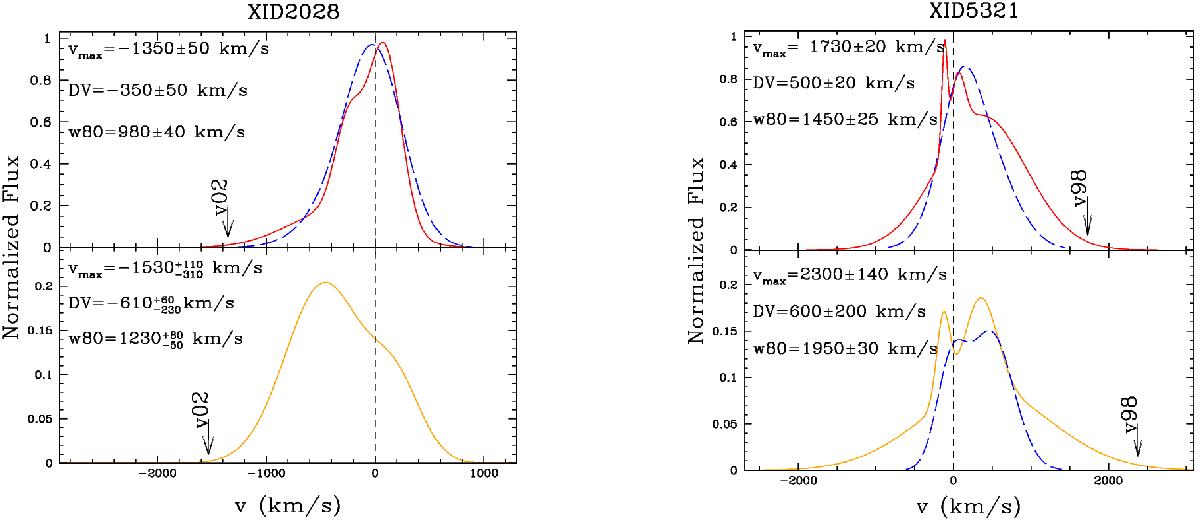
Comparison between [OIII]λ5007 velocity profiles: red curves for the nuclear apertures in the upper panels, orange curves for the off-nuclear apertures retaining the outflow emission in the lower panel. The non parametric measurements of the [OIII] fit are labeled. We also overplot in long-dashed blue the results for [OII] emission lines fit (see Sect. 4.1). The [OII] profiles are renormalized in order to facilitate a comparison with the [OIII]. The dashed lines mark the positions chosen as zero velocity (the systemics for [OIII], and the mean wavelength of the [OII] doublet), the arrows mark the 98th and 2th percentiles indicating the vmax velocities.
Current usage metrics show cumulative count of Article Views (full-text article views including HTML views, PDF and ePub downloads, according to the available data) and Abstracts Views on Vision4Press platform.
Data correspond to usage on the plateform after 2015. The current usage metrics is available 48-96 hours after online publication and is updated daily on week days.
Initial download of the metrics may take a while.