Fig. 6
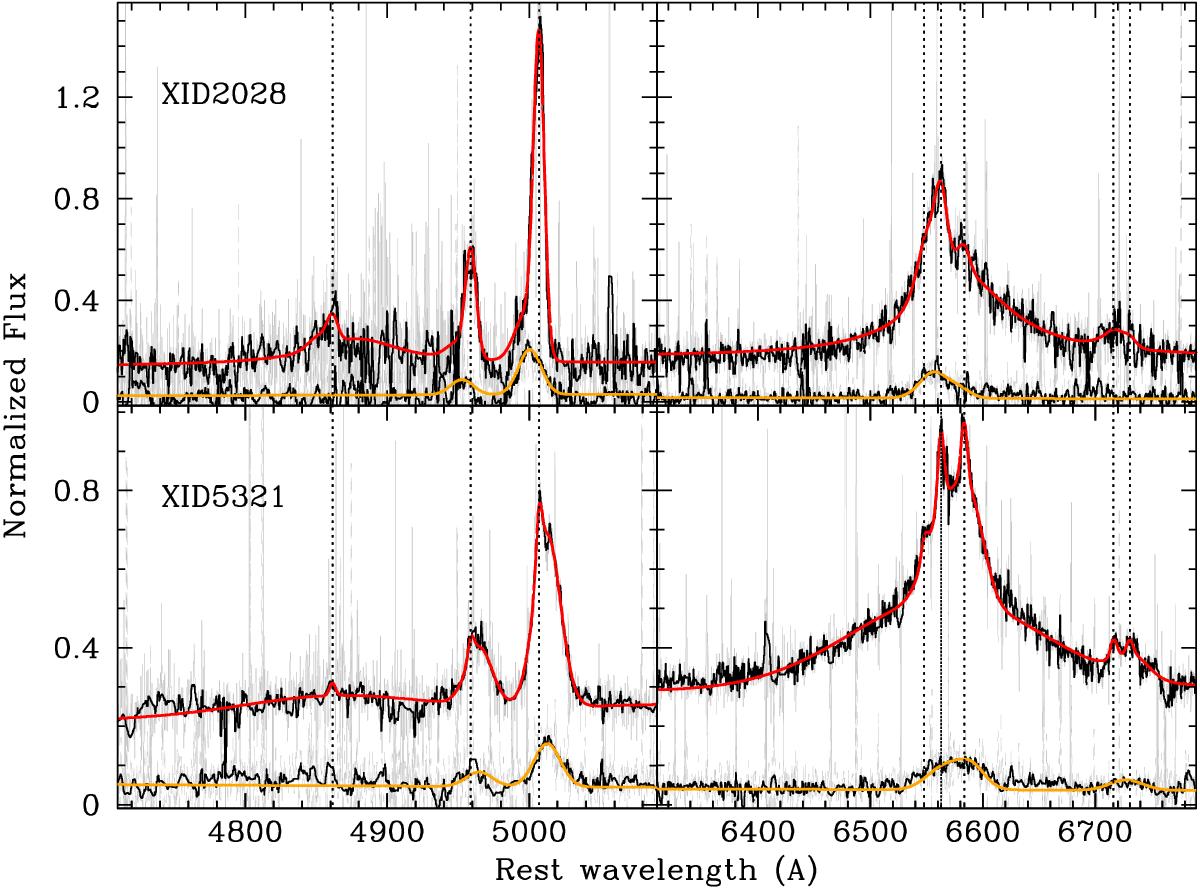
Spectra of the two quasars normalized so that the intensity of the strongest emission line of the nuclear aperture is unity. For clarity, in the figure the nuclear spectrum of XID2028 is shifted vertically in order to facilitate a visual inspection of the apertures. The gray and black lines indicate the original and the cleaned (of cosmic ray hits, bad pixels and telluric lines) spectra. The red and orange lines indicate the best fit solutions that reproduce the line profiles of the central and the lateral apertures according to the simultaneous fit approach. The dotted lines mark the wavelengths of Hβ, [OIII]λ4959, [OIII]λ5007 (left) and [NII]λ6548, Hα,[NII]λ6581, and the [SII] doublet (right), from left to right, at the systemic velocity.
Current usage metrics show cumulative count of Article Views (full-text article views including HTML views, PDF and ePub downloads, according to the available data) and Abstracts Views on Vision4Press platform.
Data correspond to usage on the plateform after 2015. The current usage metrics is available 48-96 hours after online publication and is updated daily on week days.
Initial download of the metrics may take a while.