Fig. 5
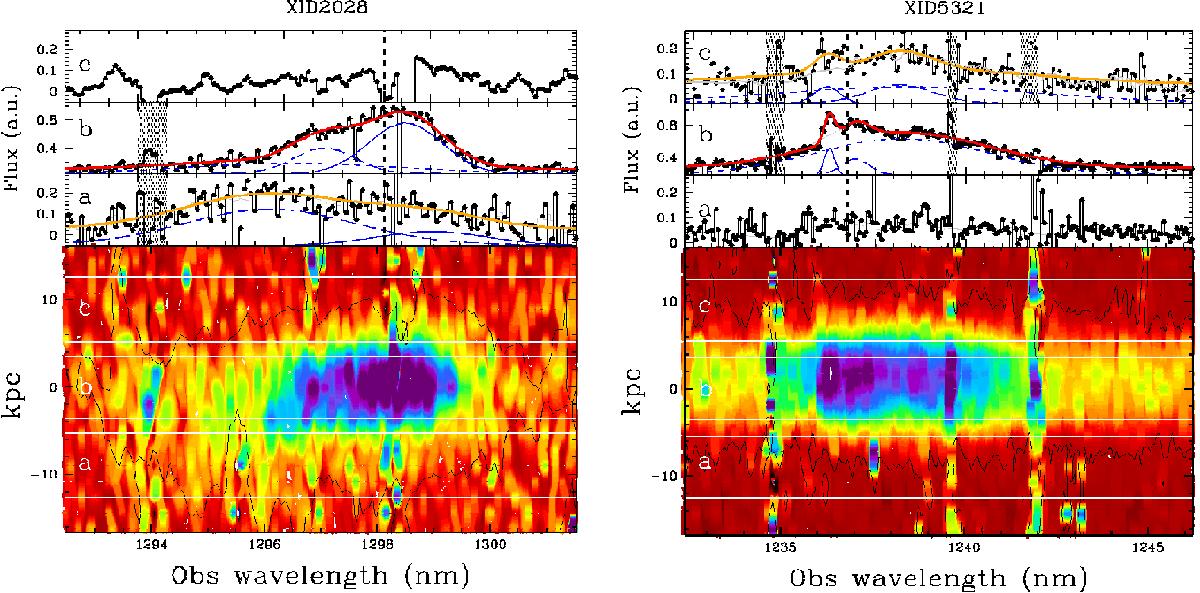
XID2028 (left) and XID5321 (right) X-Shooter spectra of the regions a, b, c, centered on [OIII]λ5007. The red and orange lines indicate the best fit solutions that reproduce the line profiles according to the non-parametric approach (see Sect. 3.2.2). The Gaussian components are shown with arbitrary normalization in order to ease the visualization. The dotted lines mark the wavelength of [OIII]λ5007 at the systemic redshift determined by B15. The lower panels show the 2D spectra, indicating the apertures used to extract the 1D spectra seen in the upper panels. Red to blue colors represent increasing flux. Extended vertical structures, like the one at ~1242 nm (right), delineate strong sky features and are indicated in the 1D spectra as shaded areas.
Current usage metrics show cumulative count of Article Views (full-text article views including HTML views, PDF and ePub downloads, according to the available data) and Abstracts Views on Vision4Press platform.
Data correspond to usage on the plateform after 2015. The current usage metrics is available 48-96 hours after online publication and is updated daily on week days.
Initial download of the metrics may take a while.