Fig. 4
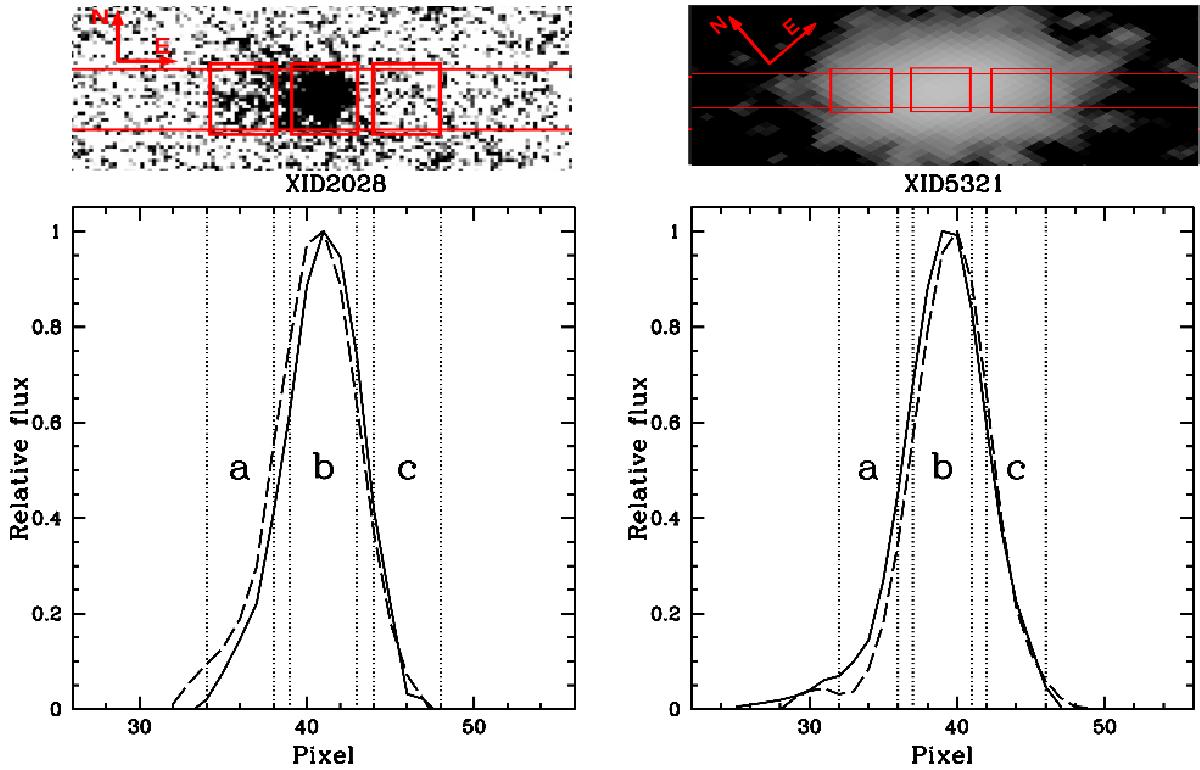
Lower panels: spatial profiles of the 2D spectrum of XID2028 (left) and XID5321 (right) of the continuum flux (solid curves) and in the proximity of [OIII]λ5007 emission line (long dashed curves). Both continuum and [OIII]λ5007 wavelength range profiles are normalized to unity. The dotted lines shows the demarcations of the three regions from which the apertures were extracted (denoted with a, b, and c). Upper panels: HST/ACS F814 image of XID2028 (left) and J-band UltraVista image of XID5321 (right) showing the position and orientation of the 0.9′′ slit and the spatial locations of the three apertures.
Current usage metrics show cumulative count of Article Views (full-text article views including HTML views, PDF and ePub downloads, according to the available data) and Abstracts Views on Vision4Press platform.
Data correspond to usage on the plateform after 2015. The current usage metrics is available 48-96 hours after online publication and is updated daily on week days.
Initial download of the metrics may take a while.