Fig. 3
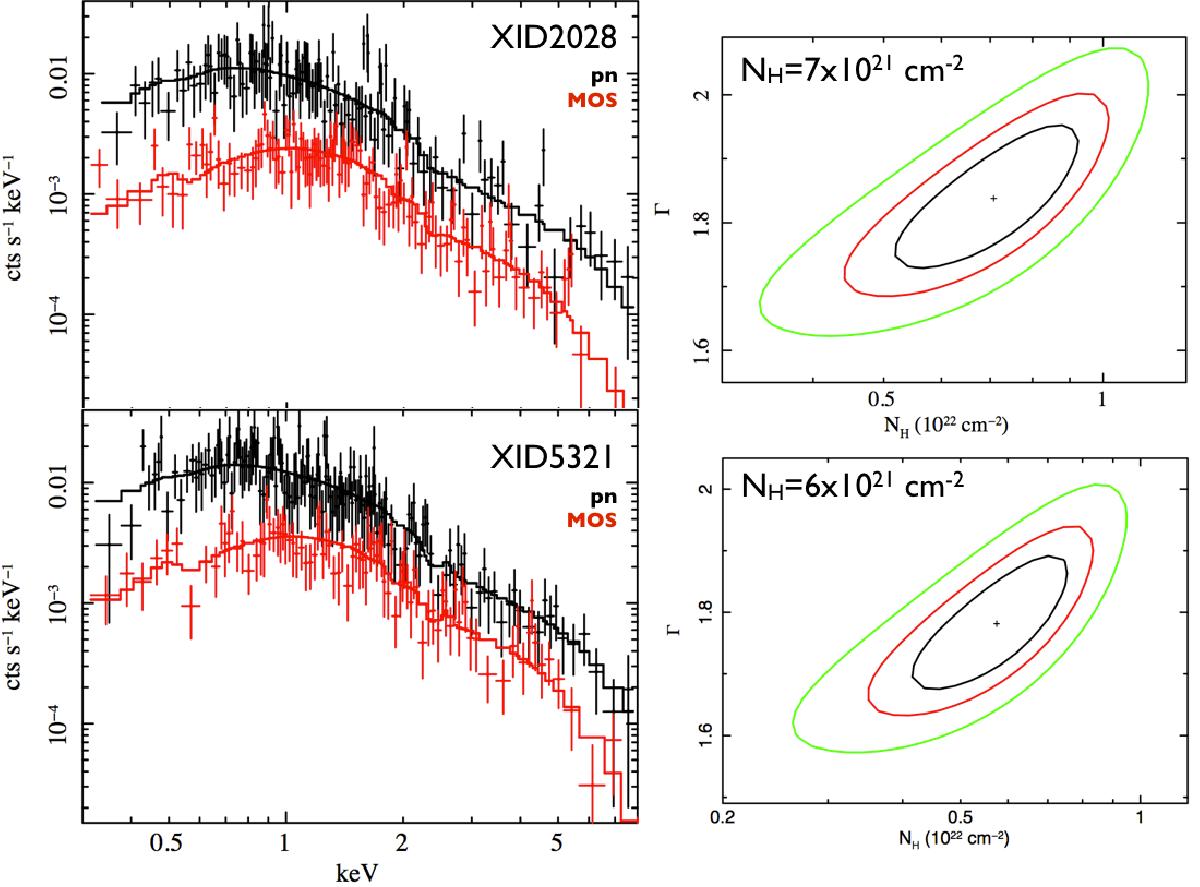
X-ray spectra of XID2028 (top, left) and XID5321 (bottom, left). The different datasets used (XMM pn and MOS), are labeled in different colors. The best fit model is also shown as a solid line for each dataset. On the right are shown the combined constraints on NH and the spectral slope, with confidence contours at 68, 95 and 99% level.
Current usage metrics show cumulative count of Article Views (full-text article views including HTML views, PDF and ePub downloads, according to the available data) and Abstracts Views on Vision4Press platform.
Data correspond to usage on the plateform after 2015. The current usage metrics is available 48-96 hours after online publication and is updated daily on week days.
Initial download of the metrics may take a while.