Free Access
Fig. 12
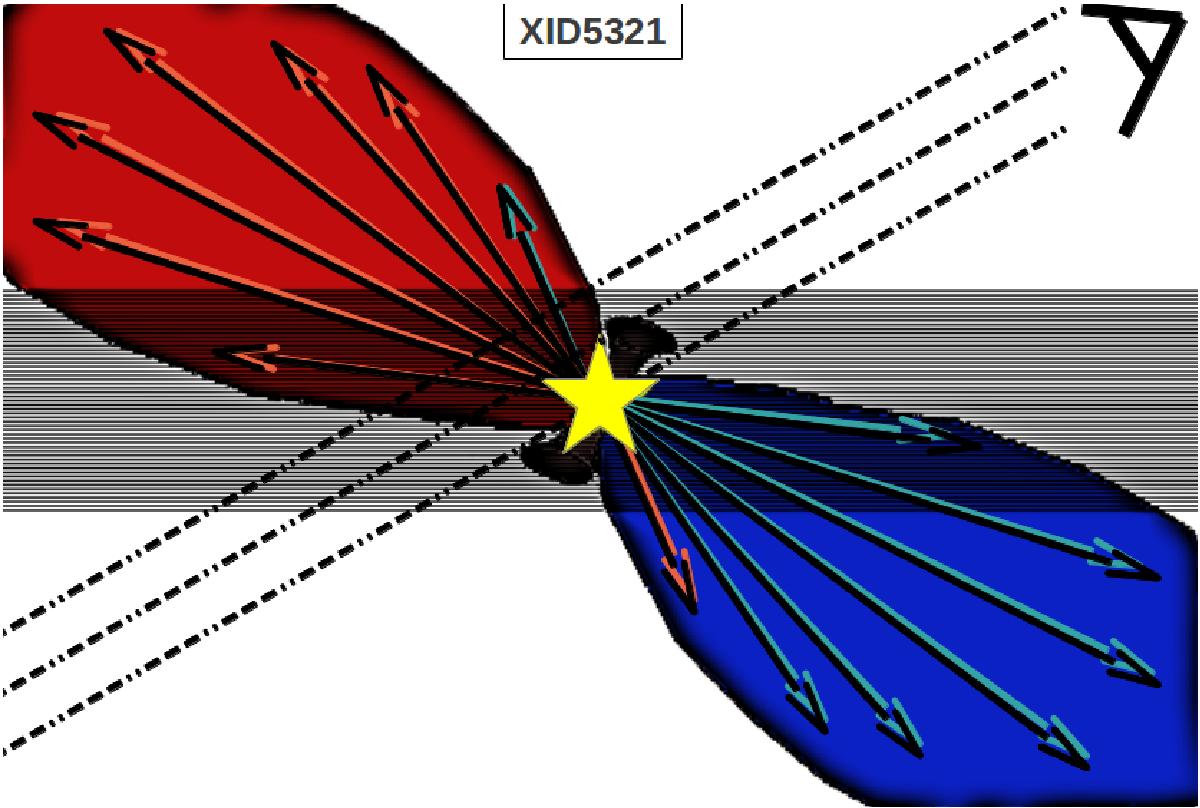
Schematic cartoon showing the extended host galaxy (gray area) and conical outflow of XID5321 (blue and red areas). The blue and red lobes represents the blueshifted and redshifted gas. The yellow star and the cylindrical shape show the position of the driving center and the torus. The line of sight is indicated.
Current usage metrics show cumulative count of Article Views (full-text article views including HTML views, PDF and ePub downloads, according to the available data) and Abstracts Views on Vision4Press platform.
Data correspond to usage on the plateform after 2015. The current usage metrics is available 48-96 hours after online publication and is updated daily on week days.
Initial download of the metrics may take a while.