Fig. 11
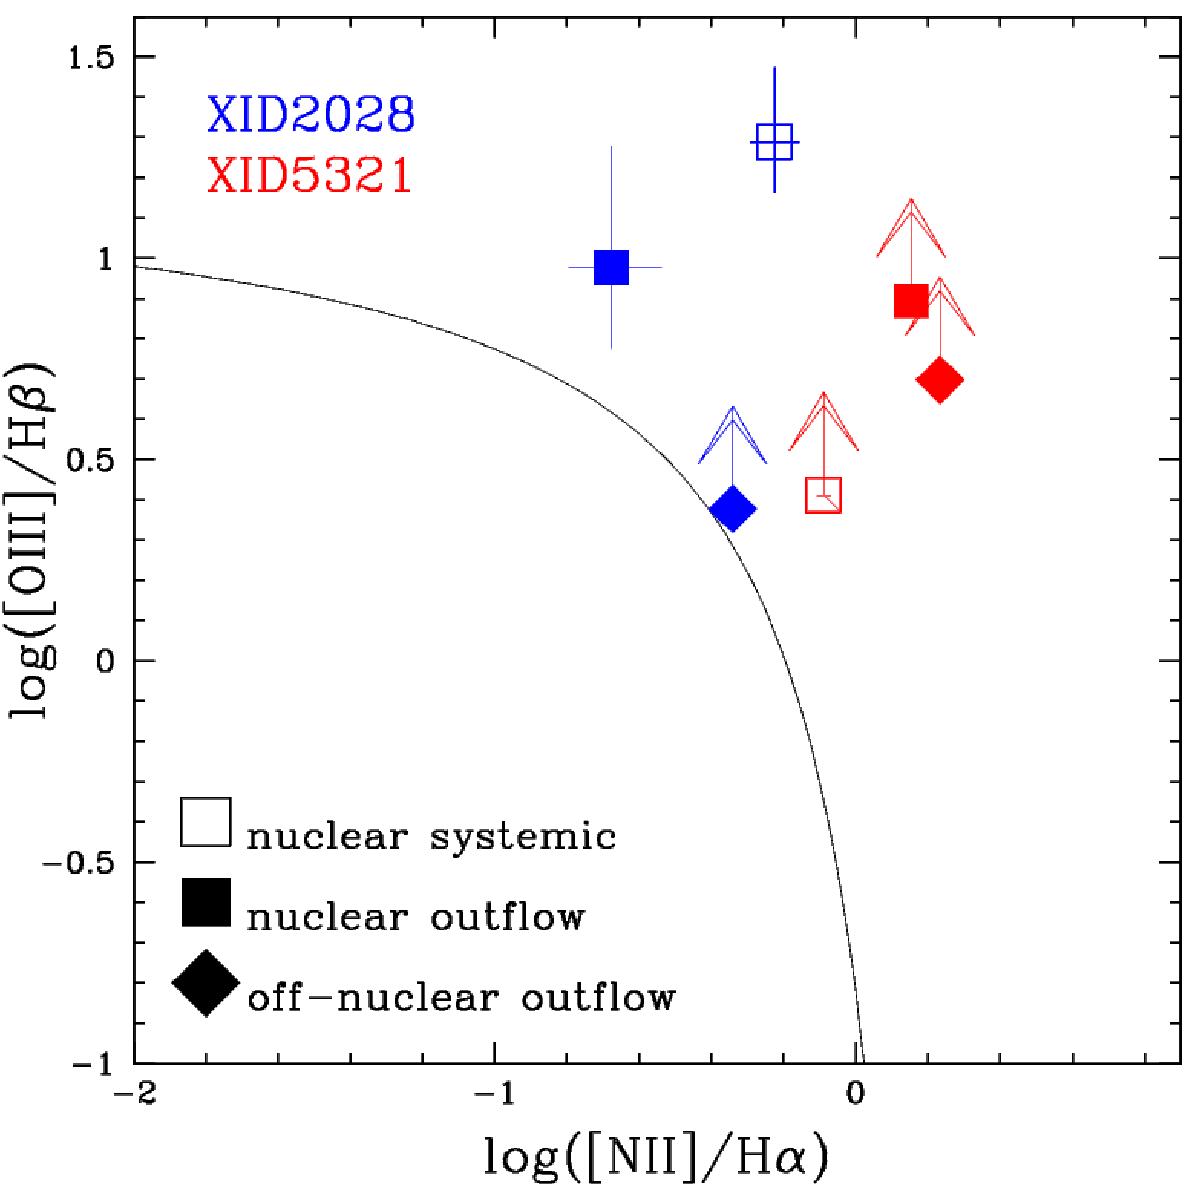
Standard diagnostic diagram showing the classification scheme by Kewley et al. (2013). The line drawn in the diagram corresponds to the theoretical redshift-dependent curve used to separate purely SF galaxies from galaxies containing AGN (Kewley et al. 2013). Empty and filled squares correspond to the systemic and outflow components of the nuclear aperture; filled diamonds correspond to the outflow components of the off-nuclear apertures. Blue and red points represents XID2028 and XID5321 respectively. Upper arrows represent lower limits, due to undetected Hβ emission lines.
Current usage metrics show cumulative count of Article Views (full-text article views including HTML views, PDF and ePub downloads, according to the available data) and Abstracts Views on Vision4Press platform.
Data correspond to usage on the plateform after 2015. The current usage metrics is available 48-96 hours after online publication and is updated daily on week days.
Initial download of the metrics may take a while.