Fig. 10
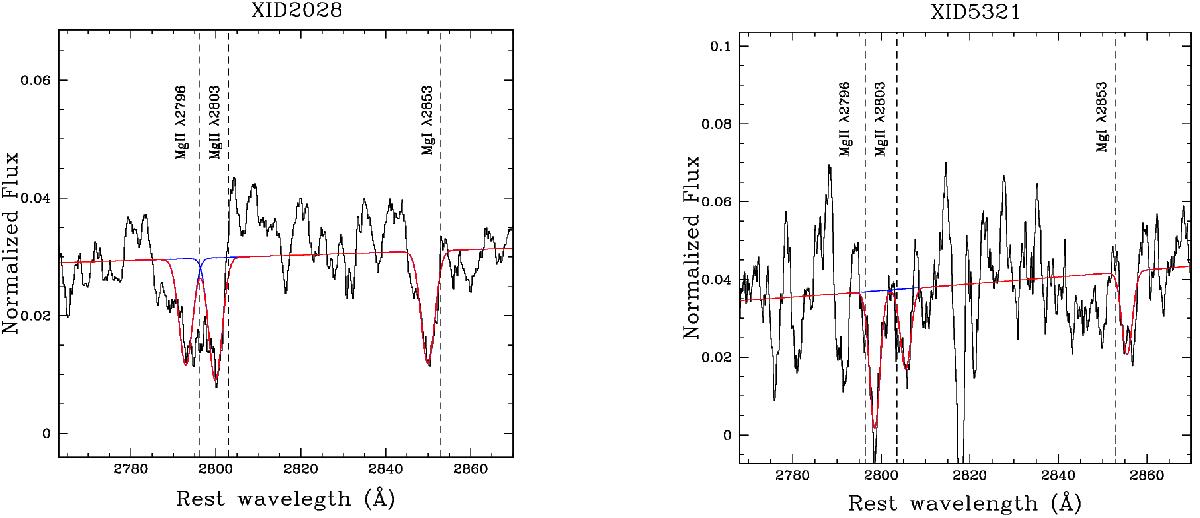
XID2028 smoothed Keck/DEIMOS spectrum (left) and XID5321 smoothed X-Shooter spectrum (right) with the magnesium absorption lines marked. The dashed lines in the spectra mark the rest-frame wavelengths of MgII and MgI, as determined from the systemic redshift. Superimposed on the spectra are the best fit components indicated as solid blue Gaussian curves. The red solid curves represent the sum of the Gaussian components.

Current usage metrics show cumulative count of Article Views (full-text article views including HTML views, PDF and ePub downloads, according to the available data) and Abstracts Views on Vision4Press platform.
Data correspond to usage on the plateform after 2015. The current usage metrics is available 48-96 hours after online publication and is updated daily on week days.
Initial download of the metrics may take a while.