Free Access
Fig. 6
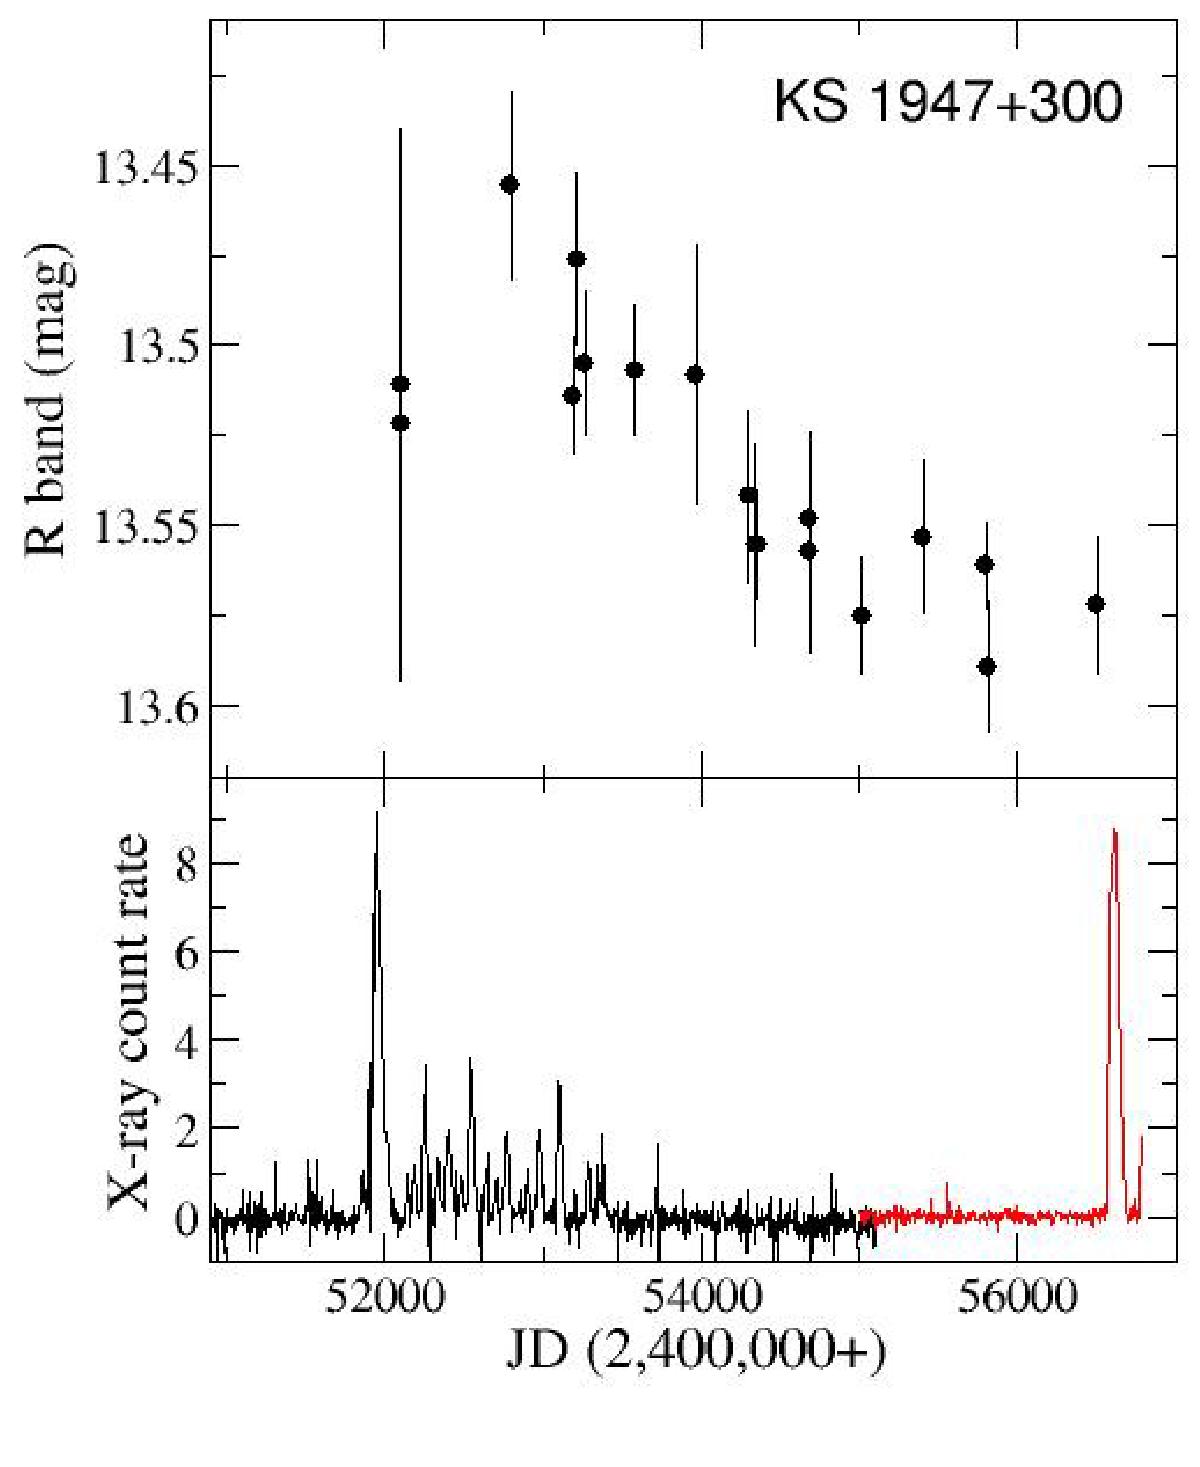
R-band and X-ray light curves of KS 1947+300 from the RXTE/ASM (black) and Swift/BAT (red) all-sky monitors. Note the longer disk variability time-scales (changes in the optical brightness) with respect to systems shown in Fig. 4.
Current usage metrics show cumulative count of Article Views (full-text article views including HTML views, PDF and ePub downloads, according to the available data) and Abstracts Views on Vision4Press platform.
Data correspond to usage on the plateform after 2015. The current usage metrics is available 48-96 hours after online publication and is updated daily on week days.
Initial download of the metrics may take a while.