Fig. 5
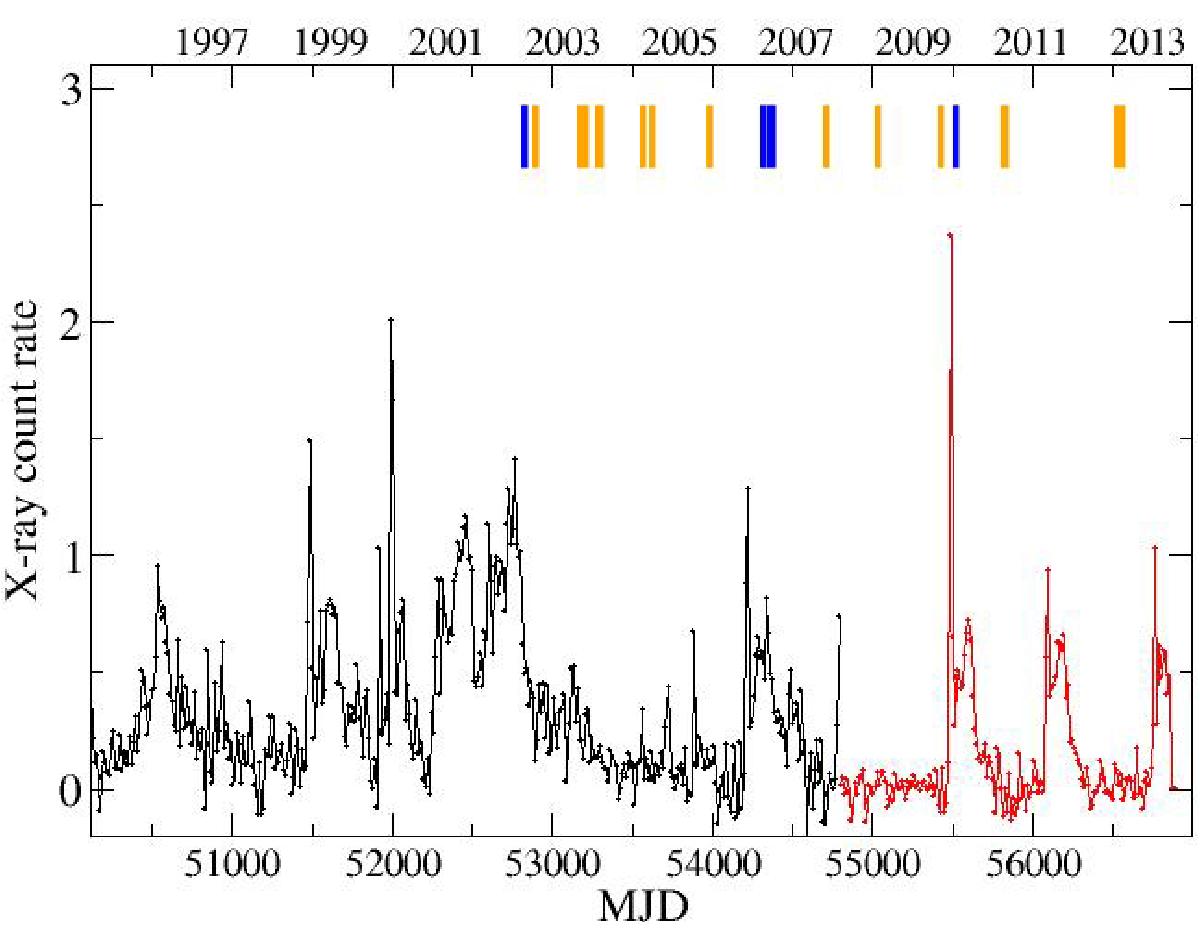
Long-term X-ray variability of SAX J2103.5+4545 as seen by the all-sky monitors RXTE/ASM (black) and SWIFT/BAT light curves (red). The original one-day resolution light curves were rebinned to a bin size equal to the orbital period (Porb = 12.67 d). The blue and orange vertical lines indicate the epochs when the BVRI magnitudes were below (brighter) and above (fainter) the average, respectively.
Current usage metrics show cumulative count of Article Views (full-text article views including HTML views, PDF and ePub downloads, according to the available data) and Abstracts Views on Vision4Press platform.
Data correspond to usage on the plateform after 2015. The current usage metrics is available 48-96 hours after online publication and is updated daily on week days.
Initial download of the metrics may take a while.