Free Access
Fig. 4
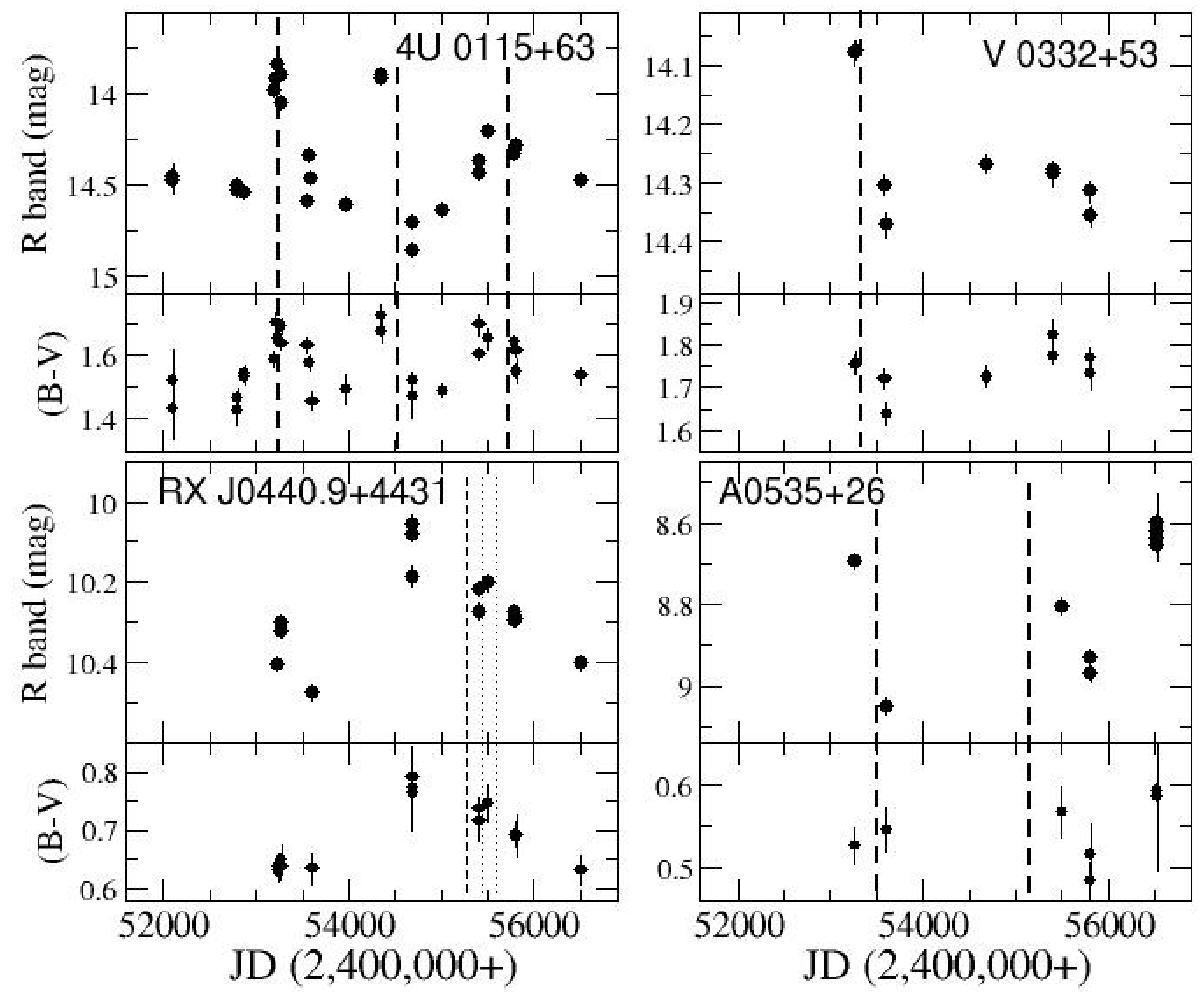
R-band and (B − V) light curves of four BeXB displaying large amplitude X-ray activity. The dashed and dotted vertical lines indicate the epochs when type II and type I X-ray outbursts occurred, respectively. A decrease in the optical brightness following the outburst is seen in all systems.
Current usage metrics show cumulative count of Article Views (full-text article views including HTML views, PDF and ePub downloads, according to the available data) and Abstracts Views on Vision4Press platform.
Data correspond to usage on the plateform after 2015. The current usage metrics is available 48-96 hours after online publication and is updated daily on week days.
Initial download of the metrics may take a while.