Fig. 8
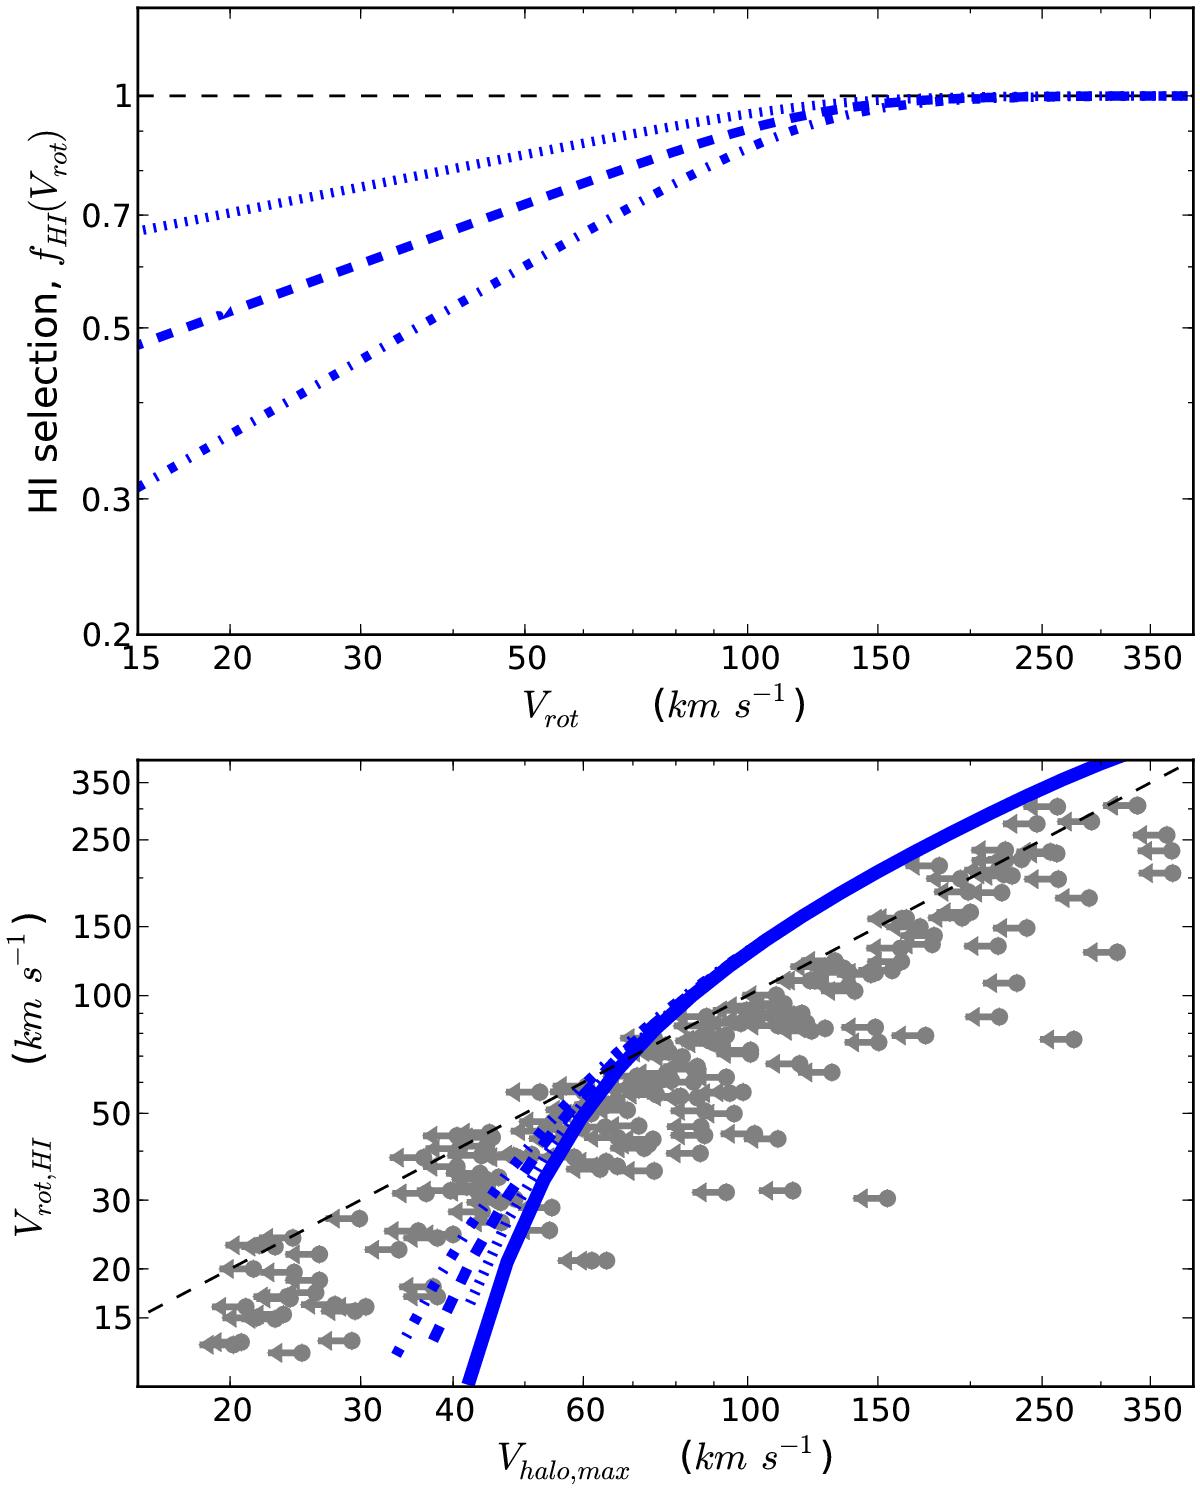
Incompleteness of the ALFALFA survey at low velocities. Top panel: the blue dotted, dashed and dash-dotted lines represent three relations for the “HI-selection” factor, fHI(Vrot), each accounting for progressively more low-velocity systems that are undetectable by ALFALFA due to their low HI mass (Eqs. (9)–(11)). Bottom panel: the blue dotted, dashed and dash-dotted lines are the average Vrot − Vh relations for the corresponding fHI(Vrot) relations shown in the top panel. For reference, we also plot our fiducial relation with a thick solid blue line (same as in Fig. 4). The gray symbols represent our sample of galaxies with HI rotation curves, same as in Fig. 6.
Current usage metrics show cumulative count of Article Views (full-text article views including HTML views, PDF and ePub downloads, according to the available data) and Abstracts Views on Vision4Press platform.
Data correspond to usage on the plateform after 2015. The current usage metrics is available 48-96 hours after online publication and is updated daily on week days.
Initial download of the metrics may take a while.