Fig. 7
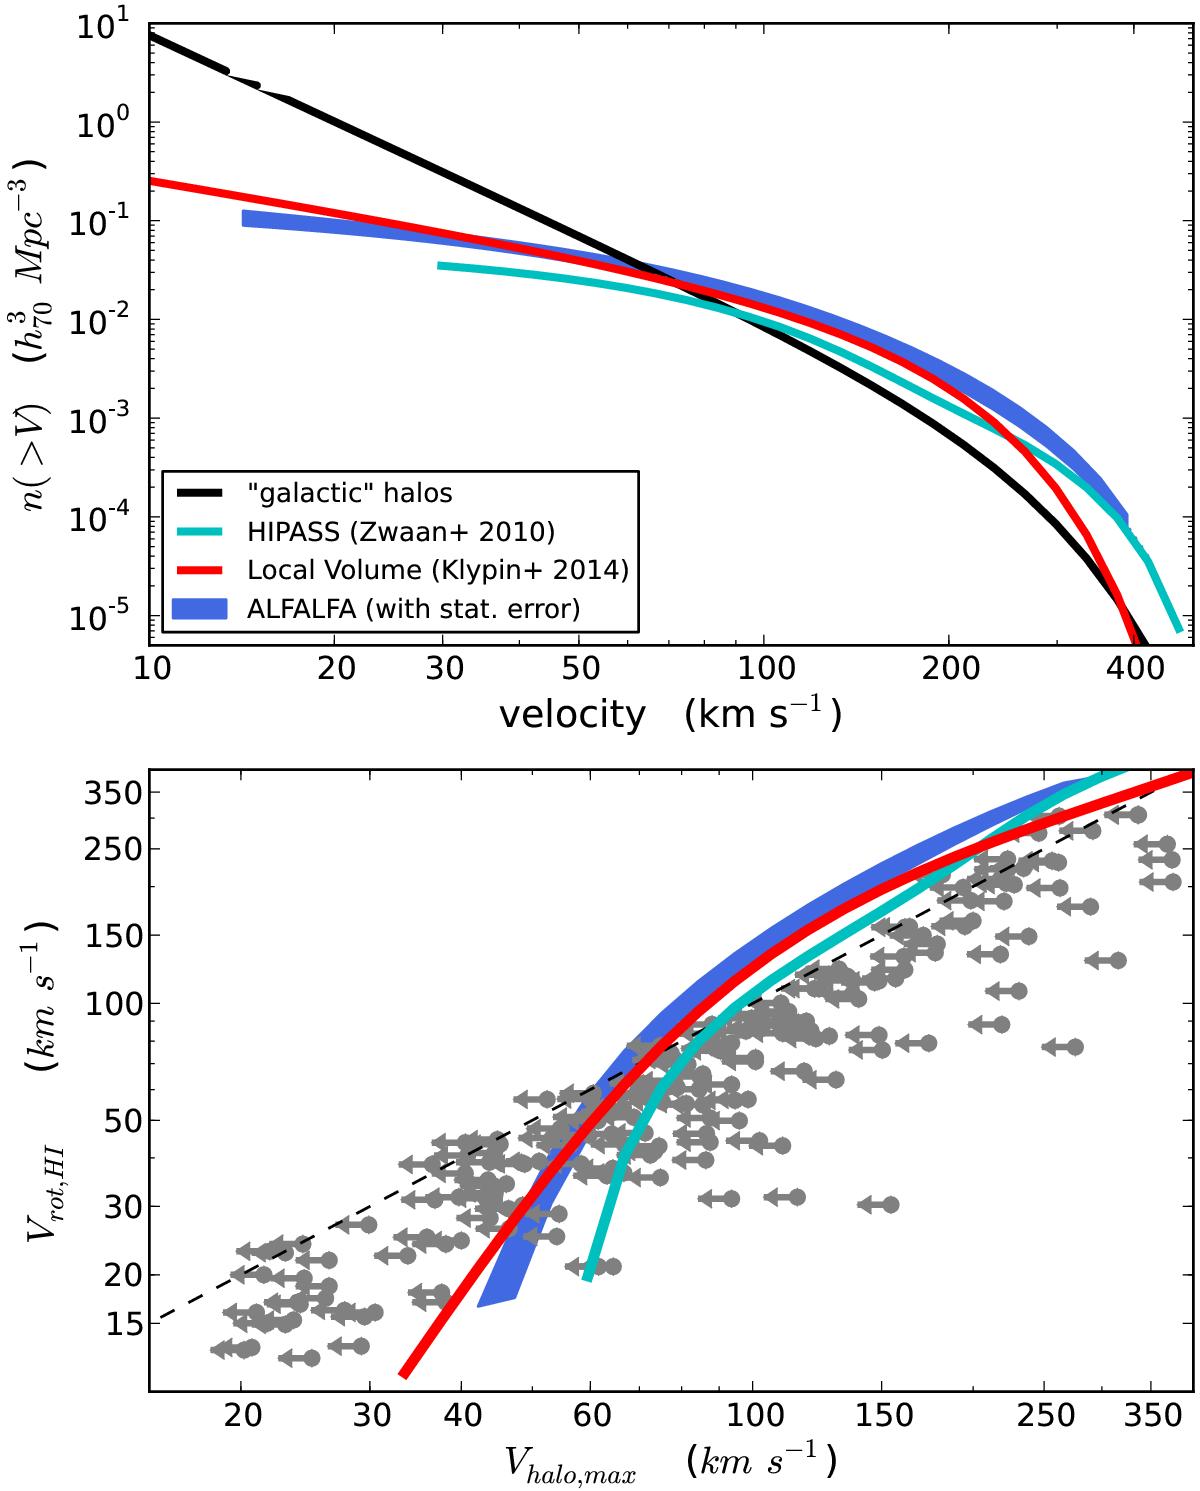
Observational uncertainties on the VF measurement. Top panel: the blue shaded region shows the range of ALFALFA cumulative VFs that correspond to modified Schechter parameters within 1σ from the best fit values (see Eq. (1)). The cyan line corresponds to the result of the HIPASS 21 cm survey (Zwaan et al. 2010), while the red line represents the cumulative VF measured in the Local Volume by Klypin et al. (2014). The two latter results are plotted to illustrate the magnitude of systematic uncertainties affecting the measurement of the VF. Bottom panel: the gray symbols represent our sample of galaxies with literature HI rotation curves (same as in Fig. 6). The colored lines represent the Vrot − Vh relation that corresponds to each of the cumulative VFs plotted in the upper panel, using the same color coding.
Current usage metrics show cumulative count of Article Views (full-text article views including HTML views, PDF and ePub downloads, according to the available data) and Abstracts Views on Vision4Press platform.
Data correspond to usage on the plateform after 2015. The current usage metrics is available 48-96 hours after online publication and is updated daily on week days.
Initial download of the metrics may take a while.