Fig. 6
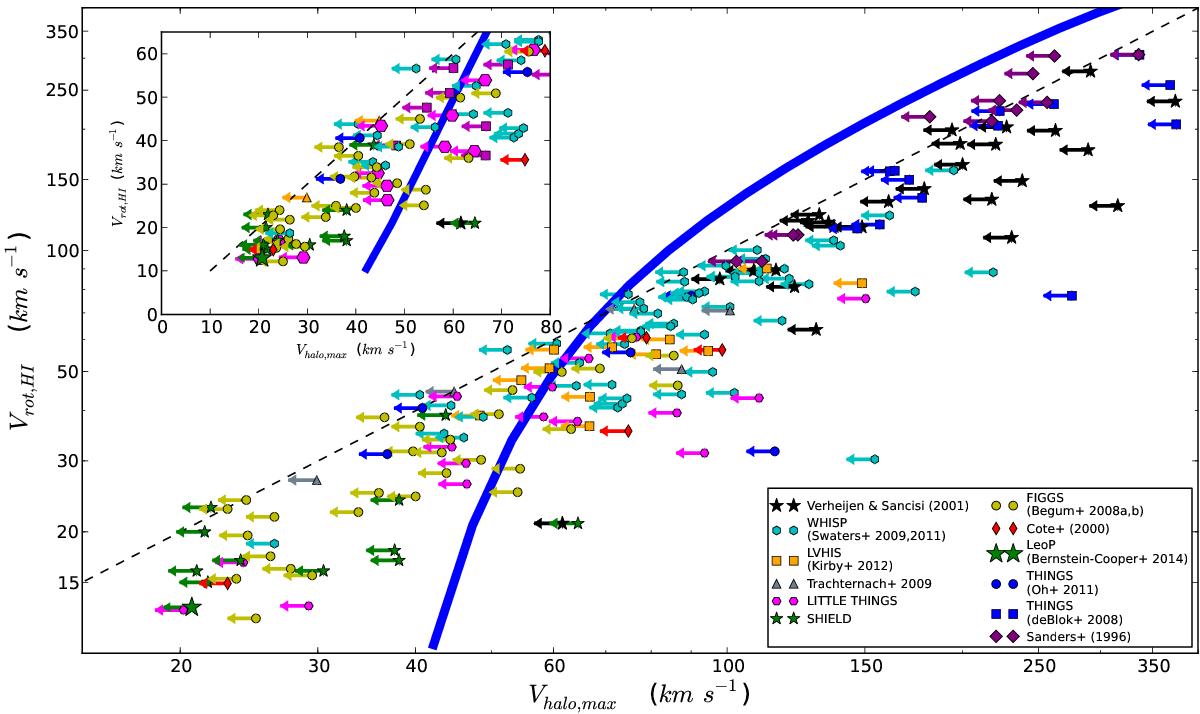
Placement of galaxies on the Vrot − Vh diagram. Main figure: the blue line is the average Vrot − Vh relation in a ΛCDM universe, inferred from abundance matching (same as in Fig. 4). The colored points represent a sample of 194 galaxies with interferometric HI observations, drawn from the literature. Their Vrot and Vh values are computed as described in Fig. 5. All points are drawn as upper limits, because we make the conservative assumption that the contribution of baryons to the galactic RC is negligible for all galaxies. Refer to Sects. 3.3 and 4 for the scientific interpretation of this figure. Inset panel: a zoom-in on the low-velocity region of the diagram (linear axes).
Current usage metrics show cumulative count of Article Views (full-text article views including HTML views, PDF and ePub downloads, according to the available data) and Abstracts Views on Vision4Press platform.
Data correspond to usage on the plateform after 2015. The current usage metrics is available 48-96 hours after online publication and is updated daily on week days.
Initial download of the metrics may take a while.