Fig. 5
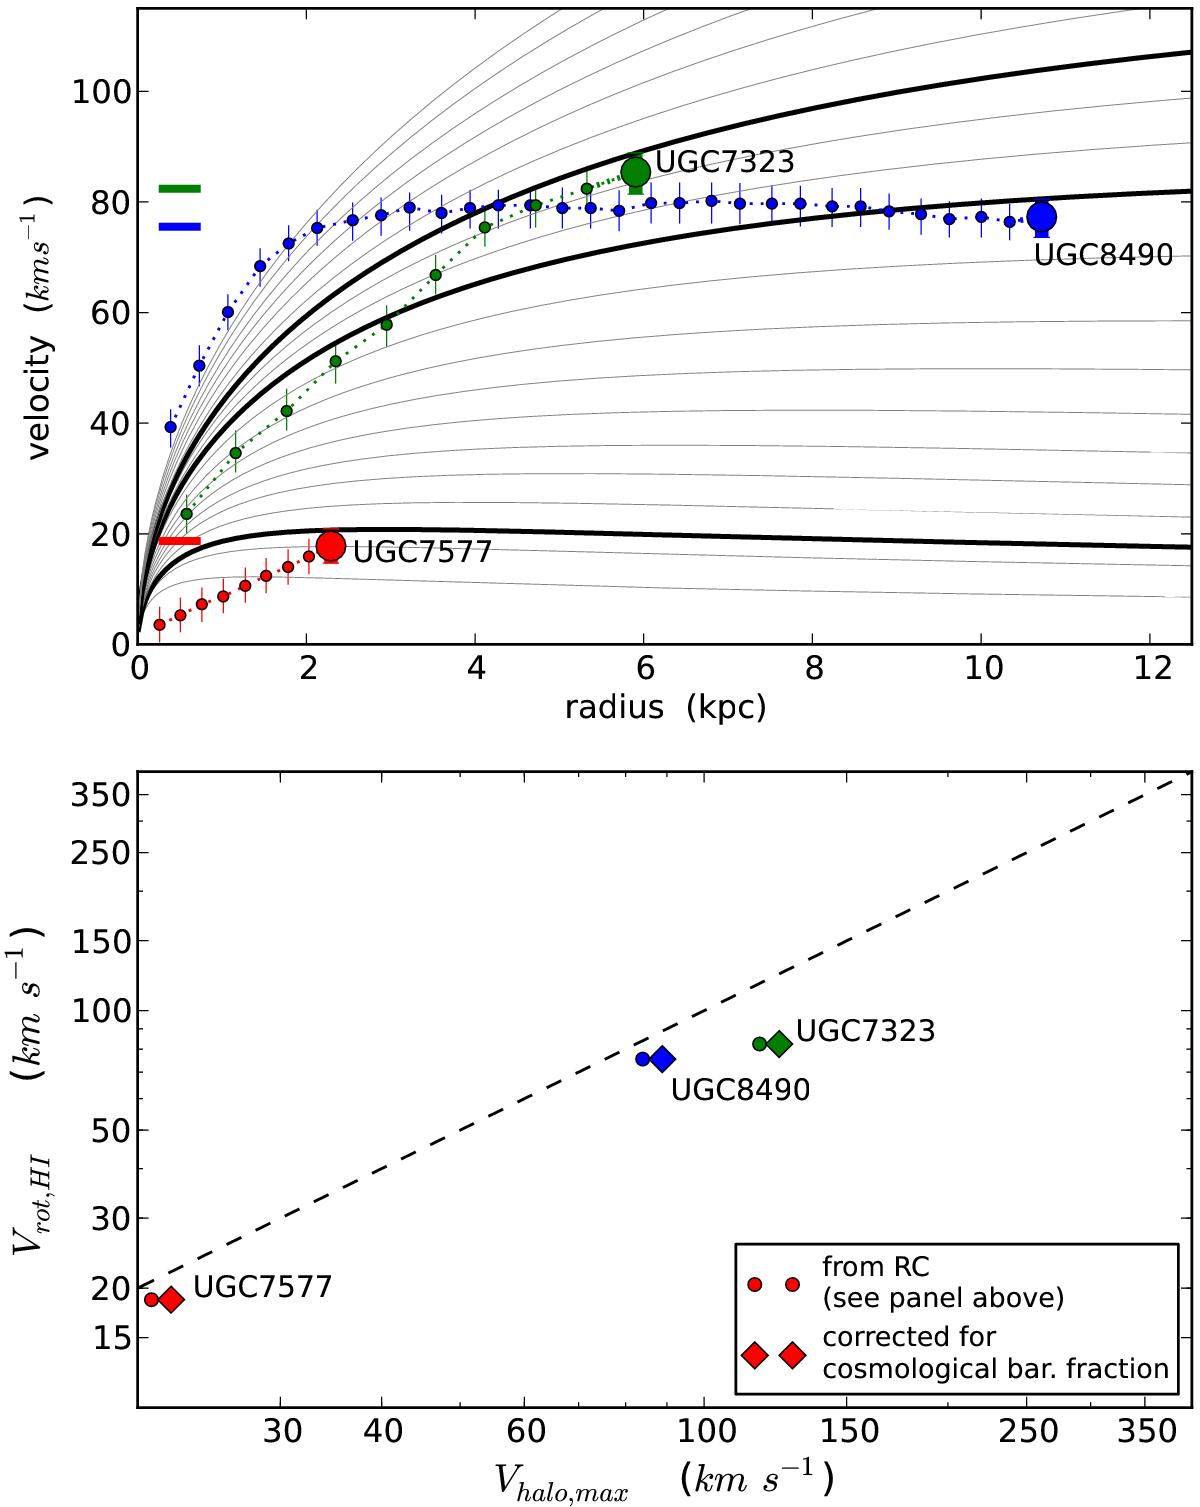
Kinematic analysis of galaxies with HI rotation curves. Top panel: three representative rotation curves (RCs) from the literature sample of galaxies with interferometric HI observations (red: UGC 7577, green: UGC 7323; blue: UGC 8490). The gray solid lines show the RCs of increasingly more massive NFW halos (from bottom to top). The concentration parameter for each halo is the median concentration expected for its mass in a Planck cosmology (Dutton & Macciò 2014). The three thick gray lines show the most massive NFW halos that are compatible with the last measured point of each galaxy’s RC (large colored symbols), to within 1σ. For each galaxy, only the last measured point of the RC is used for the analysis in this work. The peak velocity for each of these three halos is the value of Vh assigned to the corresponding galaxy. The colored horizontal marks denote the value of Vrot for the three galaxies, inferred from their inclination-corrected linewidths (see Eq. (2)). Bottom panel: small circles show the placement of UGC 7577, UGC 7323 and UGC 8490 on the Vrot − Vh diagram, according to the procedure outlined in the top panel. The large diamonds show their positions after a correction is applied to account for the cosmic baryon fraction (see text for details).
Current usage metrics show cumulative count of Article Views (full-text article views including HTML views, PDF and ePub downloads, according to the available data) and Abstracts Views on Vision4Press platform.
Data correspond to usage on the plateform after 2015. The current usage metrics is available 48-96 hours after online publication and is updated daily on week days.
Initial download of the metrics may take a while.